Research Article - (2022) Volume 12, Issue 2
Use of Institutional Library by Using Social Media in Central Universities of North-East India
Shubhasmita Acharya1* and Lulu Rout2*Abstract
The paper explores the use of social media among the students of north-east central universities for accessing and availing services provided by the institutional libraries. Where, an analysis was undertaken to highlight some key factors like the frequency of using and social media devices they use for using institutional library. The research conducted to know the time spent by both the students and research scholars of the selected universities, how many times they spent per day and how many times they spent in a week for using social media. The purpose of using social media in the selected universities is being analyzed in this paper. The SNS’s which impact majorly on social media and how frequently students, research scholars use social media for using SNSs, what were the top SNSs used by using social media are described. Lastly the pros and cons of social media are also explained with their support level.
References
Blog | Yacht Charter in Greece Best Betting Sites in Indonesia Blog | Yacht Charter in Croatia Find Lawyer in Connecticut Blog | Yacht Charter in Italy Find Lawyer in Maryland Blog | Yacht Charter in Japan Info Blockchain Technologies Blog | Yacht Charter in Philippines Obgyn Journals Blog | Yacht Charter in Saudi Arabia Education Technologies Articles Blog | Yacht Charter in Turkey Cooling Technologies Articles Blog | Yacht Charter in UK Find Lawyer in New York Blog | Yacht Charter in USA Web Technologies Articles Blog | Places to Visit in Australia Best Betting Sites in VenezuelaKeywords
Social Media, MZU, NEHU, Social Media and Students, SNSs, Social Media Awareness.
Introduction
With the advancement of World Wide Web (WWW), people around the globe are demanding various types of services by using the internet. People have revealed that by using internet services they achieve their objectives easily and efficiently. People use different communication technology and networks for information accessing storing and disseminating Out of this latest developed technology one most used one is social media. If we consider the recent condition (Corona pandemic) of the past two year the we will definitely able to identify the valuable benefits of social media and its impact on students, farmers, government, researchers, etc. The questions like how the people managed their responsibilities? How they performed their duties? How the students give up their problems? etc., can be answered by analyzing the social media and internet.
Many researches have been conducted to high light the use of social media in various contexts but very few researches has been conducted to know the use of social media for intuitional library purpose. A pilot study was conducted where author found that social media has a huge impact on the academic performance of the students (Al-Rahmi & Othman, 2013). In respect to library science majority of LIS students uses social media to use the library services, library products and about the library staff as well. Social media has a great benefit for marketing of library services due to tremendous characteristics (Khan & Bhatti, 2012). So to analyse the way they are using and how frequently they are using social media for institutional library purpose this study has been conducted.
Forms of social media
Social media is generally used as a vast term for all web-based technologies and it incorporated with the features of web 2.0 to provide various platforms like websites and applications that support users in creating and sharing content, which is called social media tools. Social media tools are of various types according to their work and functions, some of them are extremely useful for educational purposes (Wankel, 2009). Like:
Social Networking Sites (SNS): Many writers used the term social media and social networking interchangeably, but social media refers to the whole set of web technology facilitate social interacting using features of web 2.0, while social (Hamade, 2013) networking is one of the platforms of social media which help interaction and communication between common user communities or group. Social networking sites allow people to get connected to each other based on a specific interest like friendship creation, business interaction, family interaction, academic motives, political intercourse, etc. Example: Facebook, What’s App, Twitter, YouTube, LinkedIn, Instagram, Instant Messaging.
Social book-marking tools: This allows the users for bookmarking websites to easily locate the resources and share them with friends later. Example: Delicious, Diigo, Connotea.
Content delivery tools: This aims at sharing images, video, audio, and other multimedia resources over the internet for connecting people over a distance. Example: Flickr, Vimeo, RSS Feed, Podcast, SMS Enquiry.
Social community and discussion tools: This allows users of common interests to discuss and share information. Example: Portal, Discussion forum, Collaborative Publishing Tools (Blog, Wiki).
Social news tools: These are a web-based platform which allows users to post news, current event among interested people of a common area. Example: Digg.
Academic social media tools: These are the social media tools designed and developed by keeping an eye on the academic carrier and professional development Example-Academia, Zotero, Mendeley, Research Gate, Slide Share.
Related literature
As far as the literatures are concerned then authors found that there is many research has been undertaken up on the sue of social media but a little research has been undertaken for the same use with reference to the institutional library. Author has searched the literatures by using key words like ‘social media’, ‘social media in LIS’, ‘social media in library’.
Hamade, (2013) conducted research entitled as “Perception and use of social networking sites among university students” where the author analysed the use of social media on a descriptive way (Hamade, 2013). Author used questionnaire method for collection of data where he designed five major sections and distributed among students and research scholars. Out of the 300 participants there are 140 (47%) male and 160 (53%) female respondents. According to his first analysis he found that Twitter was the most used SNS then Facebook which was the second highest in number and followed by Flicker, Myspace which were 7% and 2% respectively. According to viewing and posting of SNS there were 181 respondents view Many times a day which was 60% of the total respondents and 101 post many times a day which was 33% of the respondents. There were only 21 respondents who view SNS once in a week and 45 of the respondents who post once in a week in the SNS. Research conducted by Ruleman, (2012) stated about the use of SNS among the students as well as with comparison with the faculty.
According to the first statement (Use of technology while studying/researching) of the study there were highest number of faculty who uses social media at the age between 45-60 years and with comparison respondents who used highest at the age between 20-22 years (Ruleman, 2012).
In an international conference (Buhari, Gambo, & Bashir, 2014) presented a paper known as “Use of Social Media among Students of Nigerian Polytechnic” where they highlighted the use of social media and its impacts toward the students (Buhari, Gambo, & Bashir, 2014). According to the research question on that is the reason behind using the social media there were highest mean score (4.4) of the statement that is “Students of Nigerian Polytechnic use Social Media to connect, interact chat with friends” and followed by 4.3 mean score on the use of social media on sharing of information. Then analysed the frequency of use of social media where they found that students used social media more than five hours per day with the highest mean value 4.6. As per the perception towards use of social media there were highest number of respondents replied that there was positive perception towards the use of social media with the mean value 4.2. Social media are more widely used for the ease to use purpose (Wiid, Michael, & Corinne, 2014). As per Wiid, Michael, & Corinne, 2014 in his research found that Facebook is most widely uses SNS by social media and Pinterest has very least use (Mushtaq, & Abdelmadjid, 2018). They also found that most of the student uses social media in between 0-5 hours per week. Studies also found the various attributes about the social media and their importance (Dewing, 2010). The major purpose of using social media are e-mail, instant messaging, wiki reading, sharing documents and so on as founded common in many research (Hrastinski, & Naghmeh, 2012). On the other hand social media uses are depends on the requirement and form of communication, there are no direct relationship between social media addiction and life style (Hawi & Maya, 2017). Social media has specific impact to tourism and travel. Research conducted by (Ráthonyi, 2013) highlighted the specific affects toward travel and tourism (Rathonyi, 2013). Instagram and youtube have a major impact on school going students as found by (Martin, et al., 2018). They focused various objectives of using social media by the school students and found majority (127) students uses social media to earn about other people’s/friends’ lives, what they are doing, and what is new with them.
Among the college students they use social media for the purposes of sharing pictures, videos and other entertainment related materials, the uses were very less frequently to develop their professional networks (Knight-McCord, et al., 2016). College students use these networks 1- 5 hours each day and more on weekends. Social media has a positive impact on the political participation among the students found by the authors (Ahmad, Alvi, & Muhammad, 2019).
More students use social media for enhancing their political carrier. Again in another research found that respondents use online media for YouTube, face book, Instagram majorly as per (Al-Deen & John, 2011).
Objectives of the study
The research has been conducted to satisfy the following objectives;
• To know the use of social media for using institution library.
• To identify the types of services used in their respective institution library by using social media.
• To make a comparison on the basis of different variables between the two central universities.
• To analyse the pattern of using social media among the two central universities.
• To identify the purpose of using social media.
• To identify the esteem need of using social media.
Methodology
In such type of on-going pandemic, the online questionnaire was designed by using Google forms and distributed to the students of the selected universities by email, what’s App and other instant messaging apps. The questionnaire was distributed among the on-going students of the respected universities. The number of questionnaires distributed with respect to their university and courses and the response rate has been described in Table 1.
There was total 80 (100%) online close ended questionnaire had sent to both the universities together and the chosen sampling method was snow ball sampling. All the samples are the on-going students of the respected departments (Department of Library and Information Science) of the selected universities. Out of the total there were 45(56.25%) questionnaires came back which are considered to be usable in this research. As described in Table 1 the majority of the respondents 16 (80%) of MZU belong to MLIS (Master in Library and Information Science) and the majority of respondents 11 (55%) in NEHU are PhD students. (Figure 1) describes the response rate of both the universities where the MZU will come in rank 1.
| Universities | Courses | Questionnaire Sent | Questionnaire Received | % | Total % | Cumulative % | Rank |
|---|---|---|---|---|---|---|---|
| MZU | MLIS | 20 | 16 | 80 | 64.1 | 80 | 1 |
| M.Phil | 4 | 1 | 25 | 105 | |||
| Ph. D | 15 | 8 | 53.33 | 158.33 | |||
| NEHU | MLIS | 19 | 9 | 47.36 | 46.51 | 205.69 | 2 |
| M.Phil | 4 | 0 | 0 | 205.69 | |||
| Ph. D | 20 | 11 | 55 | 260.69 | |||
| Total | 80 (100%) | 45 (56.25%) | 56.25 |
Table 1: Characteristics of Data

Figure-1: Response rate. Note: ( ) MZU; (
 ) NEHU
Data analysis
The analysis of data was done by using MS Excel 2007, SPSS and some are manually. The analysis of data has done to know some values with percentage, mean, cumulative percentage, and standard deviation.
Demographic characteristics of data
The demographic characteristic of data describes about the Gender and age of the total respondents of both the universities in a brief way. As per Table 2 given below there are more female respondents which were 23 (51.11%) than the male respondents which were 22 (48.88%). As per the characteristic of age there were 21 (46.66%) of the respondents were belong to the age of 21-24 followed by 17(37.77%) in between 25-28 followed by 5 (11.11%) were coming under the category of 37+. There were 0 (0%) numbers of respondents were coming under 18-20 and 29-32 age category (Figures 2 and 3).
| Variables (n=45) | NEHU (n=20) | MZU (n=25) | Total | % | Cumulative % | |
|---|---|---|---|---|---|---|
| F | F | |||||
| Gender | Male | 8 (40%) | 14 (56%) | 22 | 48.88 | 48.88 |
| Female | 12 (60%) | 11 (44%) | 23 | 51.11 | 99.99 | |
| Age | 18-20 | 0 (0%) | 0 (0%) | 0 | 0 | 0 |
| 21-24 | 9 (45%) | 12 (48%) | 21 | 46.66 | 46.66 | |
| 25-28 | 6 (30%) | 11 (44%) | 17 | 37.77 | 84.43 | |
| 29-32 | 0 (0%) | 0 (0%) | 0 | 0 | 84.43 | |
| 33-36 | 1 (5%) | 1 (4%) | 2 | 4.44 | 88.87 | |
| 37+ | 4 (20%) | 1 (4%) | 5 | 11.11 | 99.98 | |
Table 2: Demographic Characteristics of Respondents

Figure-2: Pie chart of gender distribution. Note: ( ) 18-20; (
 ) 21-24; (
 ) 25-28; (
 ) 29-32;
(
) 29-32;
( ) 33-36; (
 ) 37+
) 37+

Figure-3: Pie chart of age distribution. Note: ( ) Male; ( ) Female
Results
Uses and awareness of social media
To know how many of the students were using and how many were aware about the social media, the data has been analysed and represented in Table 3. In a general sense we can say most of the students (95%) were aware and using social media for their academic and nonacademic activities. By comparing result, it was found that students of MZU which were 25 (100%) were more aware than the students of NEHU which were 18 (90%) out of the total respondents in each university separately. There were 2 (10%) number of students from NEHU said that they may be aware about the social media. At last, a decision was taken to decide whether these two universities were using social media or not where, result shown that yes, both universities students are using social media. Here decision Yes= means 50 % or more than 50 % were using and No= means below 50%.
| Universities (n=45) | Variables | F | Cumulative f | % | Cumulative % | Decision | Rank |
|---|---|---|---|---|---|---|---|
| MZU (n=25) | Yes | 25 | 25 | 100 | 100 | Yes | 1 |
| No | 0 | 25 | 0 | 100 | |||
| May be | 0 | 25 | 0 | 100 | |||
| NEHU (n=20) | Yes | 18 | 18 | 90 | 190 | Yes | 2 |
| No | 0 | 18 | 0 | 190 | |||
| May be | 2 | 20 | 10 | 200 |
Table 3: Awareness towards Social Media
Use of social media for institution’s library
One question was asked to know whether the respondents were using social media to use and access the library 6 products and services or not, goggle linear scale was used to collect the data where the points range from 1 to 5. Point 1 represent Extremely Less Frequently (ELF), 2 for Less Frequently (LF), 3 for Frequently (F), 4 for High Frequently (HF) and 5 for Extremely High Frequently (EHF).
As per the analysis done in Table 4, there majority of respondents said they are using social media for using their institutional library services and products. According to the university wise data MZU is the highest use of media technology with the mean value 1.56 and after that NEHU with the mean value 1.50.
| Universities (n=45) | EHF (f) | HF (f) | F (f) | LF (f) | ELF (f) | Mean | σ |
|---|---|---|---|---|---|---|---|
| MZU | 12 (48%) | 12 (48%) | 1(4%) | 0 (0%) | 0 | 1.56 | 6.652 |
| NEHU | 10 (40%) | 10 (40%) | 0 (0%) | 0 (0%) | 0 | 1.5 | 5.5 |
| Total | 22 (88%) | 22 (88%) | 1 (4%) | 0 (0%) | 0 | - | - |
| % | 44 (97.77%) | 44 (97.77%) | 2 (4.44%) | 0 (0%) | 0 | - | - |
Table 4: Uses for Institutional Library
Time spent for institution library vs. time spent for others
The total time spent was categorised in to two categories that is time spent for ‘institution library’ related activities and times spent in ‘other’ (Non-academic) related activities. As per ‘institution library’ the mean value of MZU was 2 and the mean value of NEHU was 2.1. As per the ‘other’ purpose the mean value of MZU was 1.52 and the mean value of NEHU was 1.95. In MZU maximum student that was 14 (56%) uses few times in a day followed by 7 (28%) uses many times in day followed by 3 (12%) once in week and only 1 (4%) student uses once in day for the ‘institution library’ purpose. In NEHU as per ‘institution library’ purpose, the mean value of was 2.1 and as per the ‘other’ purpose the mean value of was 1.95. In NEHU maximum student that was 11 (55%) uses few times in a day followed by 5 (25%) uses many times in day followed by 3 (15%) once in week and only 1 (5%) student uses once in day for the ‘institution library’ purpose (Table 5).
| Universities | Purpose | Frequency | Mean | σ | |||
|---|---|---|---|---|---|---|---|
| MZU | Institution Library | Many times in a day | Few times in a day | Once in a day | once in a week | ||
| F | 7 | 14 | 1 | 3 | 2 | 5.73 | |
| % | 28 | 56 | 4 | 12 | |||
| Others | Many times in a day | Few times in a day | Once in a day | once in a week | |||
| F | 14 | 9 | 2 | 0 | 1.52 | 6.44 | |
| % | 56 | 36 | 8 | 0 | |||
| NEHU | Institution Library | Many times in a day | Few times in a day | Once in a day | once in a week | ||
| F | 5 | 11 | 1 | 3 | 2.1 | 4.32 | |
| % | 25 | 55 | 5 | 15 | |||
| Others | Many times in a day | Few times in a day | Once in a day | once in a week | |||
| F | 7 | 9 | 2 | 2 | 1.95 | 3.55 | |
| % | 35 | 45 | 10 | 10 | |||
Table 5: Purpose and Frequency of Using Social Media
Device used for availing institutional library
Devices were the major factor for using and access any internet related things. The study found that in MZU the maximum number of respondents that was 23 (92%) were using mobile phones for ‘institutional library’ followed by personal laptops which was 14 (56%) followed by PC which was 4 (16%) and very few that was 2 (8%) out of the total respondents (25) (Figure 4). In NEHU all the respondents that was 20 (100%) were using mobile phones for ‘institutional library’, followed by personal laptops which was 7 (35%), followed by PC which was 3 (15%), and 0 (0%) number of respondents uses tablets out of the total respondents (20) (Figure 5). As per the data we can assume that mobiles are the, major devices used for availing their institutional library services (Table 6).
| Universities (n=45) | Devices | F | Cumulative f | % | Cumulative % | Rank in Device Used |
|---|---|---|---|---|---|---|
| MZU (n=25) | Mobile | 23 | 23 | 92 | 92 | 1 |
| Tablet | 2 | 25 | 8 | 100 | 4 | |
| Personal Laptops | 14 | 39 | 56 | 156 | 2 | |
| PC | 4 | 43 | 16 | 172 | 3 | |
| NEHU (n=20) | Mobile | 20 | 20 | 100 | 100 | 1 |
| Tablet | 0 | 20 | 0 | 100 | 4 | |
| Personal Laptops | 7 | 27 | 35 | 135 | 2 | |
| PC | 3 | 30 | 15 | 150 | 3 |
Table 6: Devices Used

Figure-4: Devices used by MZU. Note: ( ) Mobile; (
 ) Tablet

Figure-5: Devices used by NEHU. Note: ( ) Mobile; ( ) Tablet; ( ) Personal Laptops; ( ) PC
Time spent for using institutional library
As far as the time was concerned, in MZU the time spent per day for using institutional library was highest in 2-5 hours per day and respondent falling in this category were 20 (80%) followed by 4 (16%) in the category of 1-2 hours per day and only 1 (4%) of the respondents uses 10+ hours in a day. In a week the time spent was highest 5-10 hours category which was supported by 10 (40%) of the respondents followed by 10+ by 9 (36%) and 2-5 hours by 6 (24%) number of respondents.
In NEHU the time spent per day by the students was highest in 1-2 hours per day and respondent falling in this category were 11 (55%) followed by 6 (30%) in the category of 2-5 hours per day and only 3 (15%) of the respondents uses 5-10 hours in a day. In a week the time spent was highest 5-10 hours category which was supported by 8 (40%) of the respondents followed by 10+ by 7 (35%) and 2-5 hours by 5 (25%) number of respondents (Table 7).
| Universities | Time Spent | Mean | σ | ||||
|---|---|---|---|---|---|---|---|
| MZU | In a Day | 1-2 hours | 2-5 hours | 5-10 hours | 10+ hours | ||
| F | 4 | 20 | 0 | 1 | 1.92 | 9.32 | |
| Cumulative f | 4 | 24 | 24 | 25 | |||
| % | 16 | 80 | 0 | 4 | |||
| In a Week | 1-2 hours | 2-5 hours | 5-10 hours | 10+ | X̄ | σ | |
| F | 0 | 6 | 10 | 9 | 1.44 | 4.5 | |
| Cumulative f | 0 | 6 | 16 | 25 | |||
| % | 0 | 24 | 40 | 36 | |||
| NEHU | In a Day | 1-2 hours | 2-5 hours | 5-10 hours | 10+ | X̄ | σ |
| F | 11 | 6 | 3 | 0 | 1.6 | 4.69 | |
| Cumulative f | 11 | 17 | 20 | 20 | |||
| % | 55 | 30 | 15 | 0 | |||
| In a Week | 1-2 hours | 2-5 hours | 5-10 hours | 10+ | X̄ | σ | |
| F | 0 | 5 | 8 | 7 | 3.1 | 3.55 | |
| Cumulative f | 0 | 5 | 13 | 20 | |||
| % | 0 | 25 | 40 | 35 | |||
Table 7: Day and Week Wise Time Spent
Purpose of using social media
In this section author discussed about the purpose of using social media with regard to institutional library. In MZU majority of respondents that is 22 (88%) said that they are using social media ‘For contacting library staff’, followed by 16 (64%) ‘To access library services and products’, 14 (56%) said ‘To know about the library services and products’,12 (48%) said ‘For using dtabases’8 (32%) said for ‘To know about library’ and only 2 (8%) replied that ‘For using online journals.
In NEHU majority of respondents that is 15 (75%) said that they are using social media ‘To access library services and products’, followed by 12 (60%) ‘For contacting library staff’, 10 (50%) said ‘To know about the library services and products’, 5 (25%) ‘For using online journals’, ‘For using databases’ and ‘To make fines (Table 8).
| Universities (n=45) | Variables | F | % | Cumulative f | Cumulative % |
|---|---|---|---|---|---|
| MZU (n=25) | For contacting library staff | 22 | 88 | 22 | 88 |
| To know about library | 8 | 32 | 30 | 120 | |
| To know about the library services and products | 14 | 56 | 44 | 176 | |
| Asking queries | 6 | 24 | 50 | 200 | |
| For using online journals | 2 | 8 | 52 | 208 | |
| To search OPAC | 3 | 12 | 57 | 220 | |
| To access library services and products | 16 | 64 | 73 | 284 | |
| For using databases | 12 | 48 | 85 | 332 | |
| To make fines | 7 | 28 | 92 | 360 | |
| Others | 6 | 24 | 98 | 386 | |
| NEHU (n=20) | For contacting library staff | 12 | 60 | 12 | 60 |
| To know about library | 3 | 15 | 15 | 75 | |
| To know about the library services and products | 10 | 50 | 25 | 125 | |
| Asking queries | 4 | 20 | 29 | 145 | |
| For using online journals | 5 | 25 | 34 | 170 | |
| To search OPAC | 1 | 5 | 35 | 175 | |
| To access library services and products | 15 | 75 | 50 | 250 | |
| For using databases | 5 | 25 | 55 | 275 | |
| To make fines | 5 | 25 | 60 | 300 | |
| Others | 4 | 20 | 64 | 320 |
Table 8: Purpose of using social media
Uses of social media for SNS
The use of social media for using SNS has shown that most of the respondents use the social media for the purpose of SNS. But, specifically which SNSs is more use by using social media than others were being analysed in Table 9. In MZU there were 20 (80%) of the respondents replied they uses social media for Facebook followed by 12 (48%) respondents said for using Twitter, 6 (24%) of the respondents uses for LinkedIn, 4(16%) of the respondents uses for Zotero and only 2(8%) uses for MySpace and Skype. There were 0 (0%) of the respondents uses Friendster, Second Life and Delicious (Figure 6).
| Universities | SNS | F | % | Cumulative f | Cumulative % |
|---|---|---|---|---|---|
| MZU (n=25) | 20 | 80 | 20 | 80 | |
| MySpace | 2 | 8 | 22 | 88 | |
| Friendster | 0 | 0 | 22 | 88 | |
| Bebo | 1 | 4 | 23 | 92 | |
| Flickr | 1 | 4 | 24 | 96 | |
| 6 | 24 | 30 | 120 | ||
| Second Life | 0 | 0 | 30 | 120 | |
| Delicious | 0 | 0 | 30 | 120 | |
| Skype | 2 | 8 | 32 | 128 | |
| 12 | 48 | 44 | 176 | ||
| Zotero | 4 | 16 | 48 | 192 | |
| NEHU (n=20) | 14 | 70 | 14 | 70 | |
| MySpace | 1 | 5 | 15 | 75 | |
| Friendster | 0 | 0 | 15 | 75 | |
| Bebo | 0 | 0 | 15 | 75 | |
| Flickr | 1 | 5 | 16 | 80 | |
| 6 | 30 | 22 | 110 | ||
| Second Life | 0 | 0 | 22 | 0 | |
| Delicious | 1 | 5 | 23 | 115 | |
| Skype | 2 | 10 | 25 | 125 | |
| 4 | 20 | 29 | 145 | ||
| Zotero | 1 | 5 | 34 | 150 |
Table 9: Uses of Social Media for SNSs

Figure-6: SNSs uses in MZU. Note: () Facebook; ( ) MySpace; ( ) Bebo; ( ) Flickr; ( )
LinkedIn; ( ) Skype; ( ) Twitter; (
 ) Zotero
In NEHU there were 14 (70%) of the respondents replied they uses social media for Facebook followed by, 6 (30%) of the respondents uses for LinkedIn, 4 (20%) respondents said for using Twitter, 1 (5%) of the respondents uses for Zotero, Flickr and MySpace. There were 0(0%) of the respondents uses Friendster, Bebo and Second Life (Figure 7).

Figure-7: SNSs uses in NEHU. Note: ( ) Facebook; ( ) MySpace; ( ) Flickr; ( ) LinkedIn; ( )
Delicious; ( ) Skype; ( ) Twitter; ( ) Zotero
Positive and negative impact of social media towards students
With the positive side of the social media it found that social media has a great impact in learning activities as supported by 33 (73.33%) respondents in both the universities with the mean value 1.45 followed by 28(62.22%) supported with the mean value 1.42 to the statement that was social media helps to get in touch with family/friends followed by 27(60%) respondents with the mean value 1.37 supported that social media helps to know the social activities and 21(46.66%) supported to the statement that was social media helps in entertainment with mean value 1.28 (Ali, 2017).
In the opposite side which was negative side where 39(86%) of the respondents in both the universities supported to the statement that social media affects in spending too much time followed by 26(57%) of the respondents supported that social media has a negative impact on Neglecting study/work, 11(24.44%) respondents said social media affects in neglecting social activities and only 9(20%) support the statement others (Table 10).
| MZU (n=25) | NEHU (n=20) | Total | X̄ | σ | |
|---|---|---|---|---|---|
| Positive Effects | |||||
| Helps in learning activities | 18 (72%) | 15(75%) | 33 (73.33%) | 1.45 | 2.12 |
| Helps to get in touch with family/friends | 16(64%) | 12(60%) | 28(62.22%) | 1.42 | 2.82 |
| Helps to know the social activities | 17(68%) | 10(50%) | 27(60%) | 1.37 | 4.94 |
| Helps in entertainment | 15(60%) | 6(30%) | 21(46.66%) | 1.28 | 6.36 |
| Negative Effects | |||||
| Neglecting study/work | 13(52%) | 13(65%) | 26(57%) | 1.5 | 0 |
| Spending too much time | 23(92%) | 16(80%) | 39(86%) | 1.41 | 4.94 |
| Neglecting social activities | 6(24%) | 5(25%) | 11(24.44%) | 1.45 | 0.7 |
| Others | 5(20%) | 4(20%) | 9(20%) | 1.44 | 0.7 |
Table 10: Positive and negative impact of social media
Discussion
As per the response rate described in the Table 1 there were higher response rate in MZU (64.10%) than NEHU (46.51%) where there were more number of MLIS students (80%) in MZU and more Ph.D students (55%) from NEHU. According to gender and age wise analysis there were female respondents which were 23 (51.11%), male respondents which were 22 (48.88%) and there were 21 (46.66%) of the respondents were belong to the age of 21-24 was found. As far as the use is concerned, it found that both the university students and research scholars use social media technologies for accessing and availing their institutional library services. In MZU the most common purpose of social media was to contact library staff which was supported by 22 (88%) of the respondents while in NEHU, the majority of the respondents 15 (75%) chosen for the purpose of accessing library services and products. In MZU as per time spent maximum respondents 20 (80%) were coming under the category of 2-5 hours per day while in NEHU, there were highest in the category of 1-2 hours per day and respondent falling in this category were 11 (55%). Facebook is the highly used SNS by using social media. In MZU there were 20 (80%) of the respondents replied they uses social media for Facebook and in NEHU 14 (70%) of the respondents replied they uses social media for Facebook. At last in the positive side of social media it was found that social media has a great impact on learning activities as supported by 33 (73.33%) respondents in both the universities and followed by 28(62.22%) supported, in the negative side there were 39(86%) of the respondents in both the universities supported to the statement that social media affects in spending too much time followed by 26(57%) of the respondents supported that social media has a negative impact on Neglecting study/work. Research has also been carried out to know the relation between social media with comparison to life satisfaction and self-esteem.
Conclusion
It is evident from the above study, that social media in coming days shall play an important role in enhancing the learning opportunities of students and scholars. Due to its advantages of sharing and disseminating information around the world, the academic institution needs to encourage and support this advancement of technology in the greater interest of academic and research community. The society act as a divergent factor for mobilising the impact of social media may be its positive impact or may be towards the negative. Various orientation programmes should be taken in consideration by the libraries as well as the organisation to improve the positive impact of the social media among the students and researchers. Again, as time is the super factor of using social media, the users of social media need to focus the time management. Majority of the research found that students use most of the time out of a day for using social media. As the research found that Facebook and what’s App were the major SNSs for using social media so, every organisation should keep focus on theses while marketing any service or any products.
References
- Ahmad, Taufiq, Aima Alvi, and Muhammad Ittefaq. "The use of social media on political participation among university students: An analysis of survey results from rural Pakistan." Sage Open 9.3 (2019): 2158244019864484.
- Al-Deen, Hana S. Noor, and John Allen Hendricks. "Social media: Usage and impact." Lexington books, 2011.
- Al-Rahmi, W, and M. Othman. "The impact of social media use on academic performance among university students: A pilot study." Journal of information systems research and innovation 4.12 (2013): 1-10.
- Ali, Murad, et al. "Strengthening the academic usage of social media: An exploratory study." Journal of King Saud University-Computer and Information Sciences 29.4 (2017): 553-561.
- Buhari, Sanusi Rufai, Gambo Ibrahim Ahmad, and Bashir HadiAshara. "Use of social media among students of Nigerian polytechnic." International Conference on Communication, Media, Technology and Design 2.4 (2014): 302-305.
- Dewing, Michael. Social media: An introduction. Ottawa: Library of Parliament 1. (2010).
- Hamade, Samir N. "Perception and use of social networking sites among university students." Library Review 62.6/7 (2013): 388-397.
- Hawi, Nazir S., and Maya Samaha. "The relations among social media addiction, self-esteem, and life satisfaction in university students." Social Science Computer Review 35.5 (2017): 576-586.
- Hrastinski, Stefan, and Naghmeh M. Aghaee. "How are campus students using social media to support their studies? An explorative interview study." Education and Information Technologies 17.4 (2012): 451-464.
- Khan, Shakeel Ahmad, and Rubina Bhatti. "Application of social media in marketing of library and information services: A case study from Pakistan." Webology 9.1 (2012): 1-8.
- Knight-McCord, Jasmine, et al. "What social media sites do college students use most." Journal of Undergraduate Ethnic Minority Psychology 2.21 (2016): 21-26.
- Martin, Florence, et al. "Middle school students’ social media use." Journal of Educational Technology & Society 21.1 (2018): 213-224.
- Mushtaq, Ahmad Jahed, and Abdelmadjid Benraghda. "The effects of social media on the undergraduate students’ academic performances." Library Philosophy and Practice 4.1 (2018).
- Rathonyi, Gergely. "Influence of social media on tourism–especially among students of the University of Debrecen." Applied Studies in Agribusiness and Commerce 7.1 (2013): 105-112.
- Ruleman, Alice B. "Social media at the university: A demographic comparison." New Library World 113.7/8 (2012): 316-332.
- Wankel, Charles. "Management education using social media." Organization Management Journal 6.4 (2009): 251-262.
- Wiid, Johannes A., Michael C. Cant, and Corinne E. Nell. "Perceptions and uses of social media networking systems by South African students." International Business & Economics Research Journal (IBER) 13.4 (2014): 715-726.
Author Info
Shubhasmita Acharya1* and Lulu Rout2*2Department of Library and Information Science, Fakir Mohan University, Balasore-756001, Odisha, India
Received: 24-Mar-2022, Manuscript No. IJLIS-22-58092; Editor assigned: 28-Mar-2022, Pre QC No. IJLIS-22-58092(PQ); Reviewed: 11-Apr-2022, QC No. IJLIS-22-58092; Revised: 18-Apr-2022, Manuscript No. IJLIS-22-58092 (R); Published: 28-Apr-2022, DOI: 10.35248/2231-4911.22.12.831
Copyright: This is an open access article distributed under the terms of the Creative Commons Attribution License, which permits unrestricted use, distribution, and reproduction in any medium, provided the original work is properly cited.
Call for Papers
Authors can contribute papers on
What is Your ORCID
Register for the persistent digital identifier that distinguishes you from every other researcher.
Social Bookmarking
Know Your Citation Style
American Psychological Association (APA)
Modern Language Association (MLA)
American Anthropological Association (AAA)
Society for American Archaeology
American Antiquity Citation Style
American Medical Association (AMA)
American Political Science Association(APSA)

Google Scholar citation report
Citations : 1680
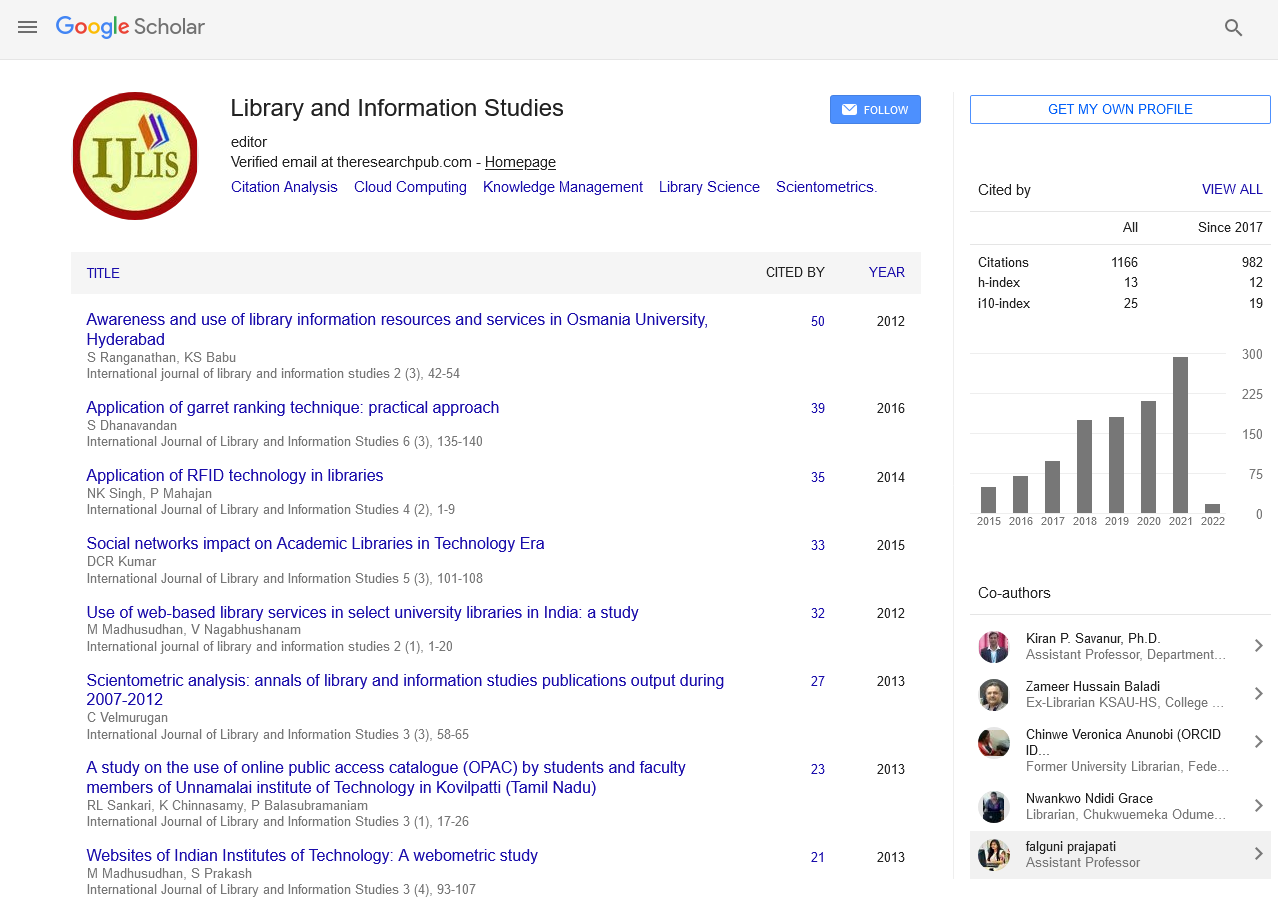
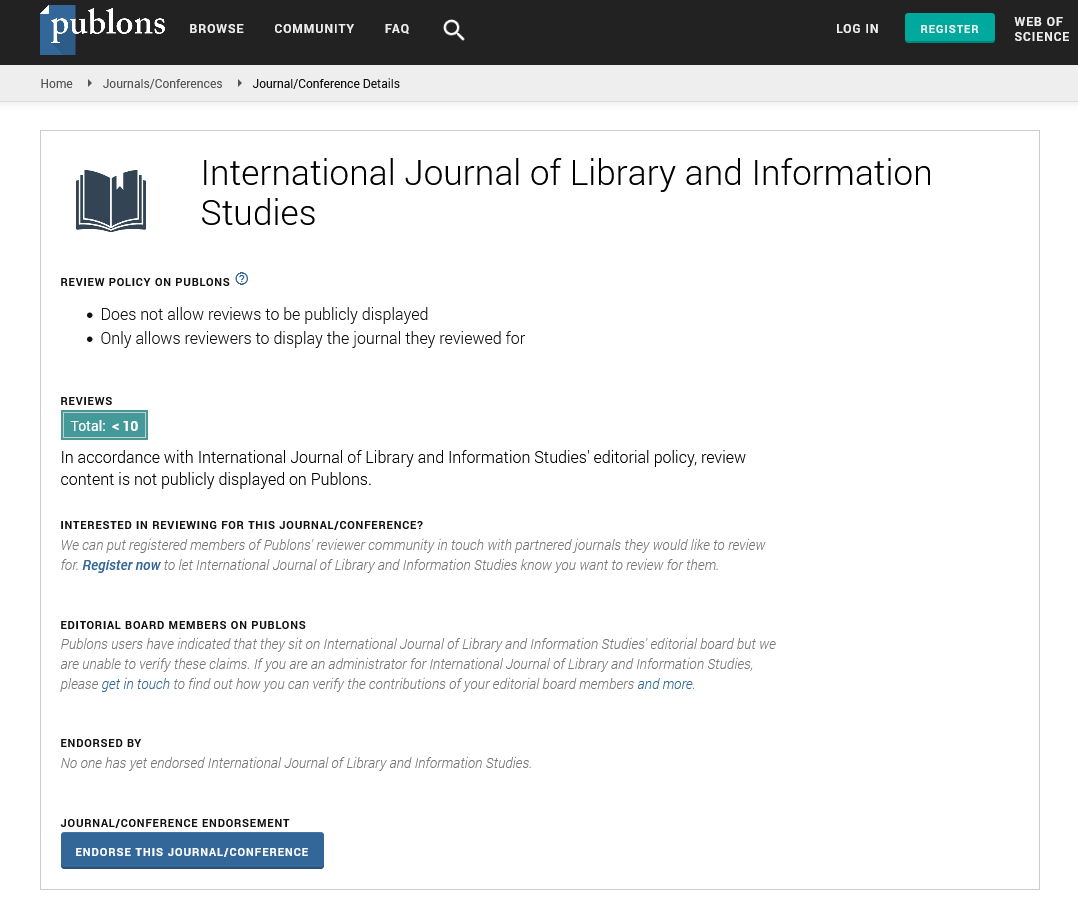
International Journal of Library and Information Studies peer review process verified at publons
Indexed In
Bibliography & Citation Tools