
Research - (2022) Volume 12, Issue 1
Scientometric Analysis of Diabetics Research Output From Scopus Database during 1971-2020 in India
S. Ravichandran* and S. Vivekananda*Abstract
This study aim to scientometric analysis of diabetic’s research publications from the Scopus database during 1971-2020 in India with a total number of 19756 research publications. During the study period a maximum of 8323(42.13%) research publications are contributed in the block years 2016-2020. The relative growth rate is 0.86 in the block years 1971-1975 and 0.55 in the block years 2016-2020. At the same time doubling time found that 0.81 in the block years 1971-1975 and 1.27 in the block years 2016-2020. The maximum of 15778(79.86%) research publications are contributed by article. The maximum of 4304(21.79) publications are contributed by more than five authorship pattern. The average degree of collaboration is 0.95. The average collaborative co-efficient value is 0.62. The average collaboration index value is 3.38.The maximum of 303(23.17%) research publications are contributed by Mohan, a maximum of 5548(56.64%) research publications are contributed by Biochemistry, Genetics, and Molecular Biology. The maximum of 597(18.27%) research publications are contributed by the all India Institute of medical sciences, New Delhi. The maximum of 1010(35.84%) research publications are collaborated country by United Status. The time series analysis statistical application will be expected in the diabetics research publications in the year 2025 is around are equal to 31352 and the year 2030 is around are equal to 34072.
Keywords
Authorship Pattern, Relative Growth Rate, Co-Author Index, Collaborative Co-Efficient, Collaborative Index, Degree of Collaboration, Time Series Analysis.
Introduction
Diabetes mellitus is one of the most common and serious chronic diseases in the United States. About 16 million Americans have diabetes, 5.4 million of whom do not know they have the disease. Diabetes is the leading cause of adult blindness, end-stage renal disease, and non-traumatic lower-extremity amputations (as a result of nerve disease). People with diabetes are 2-4 times more likely to have coronary heart disease and stroke than people without diabetes. In addition, poorly controlled diabetes can complicate pregnancy birth defects are more common in babies born to women with diabetes. Diabetes is a metabolic disease in which the body does not produce or properly use insulin, a hormone that is needed to convert sugar, starches, and other food into energy needed for daily life. There are three main types of diabetes, all of which are characterized by high levels of blood glucose (sugar).
Scientometrics study
Scientometric is one of the truly interdisciplinary research fields to extend almost all scientific fields. In addition, many extensive bibliometric studies of important science fields appeared during the last two decades. At present, the connotation of bibliometric turns out to be the science of measurement relating to documents. The word measurement means the application of mathematical and statistical techniques to find out the growth of documents, scattering, or literature in various types of documents, publication of documents by an author, impact of document, and so on. Cole and Eales (1917)2 in their publication on the history of comparative anatomy, applied statistical methods for analyzing the literature are called it statistical analysis. The most important contribution was made by Hulme (1923)3 when he published the book statistical bibliography, this term continued to be used for statistical measures till the end of the 1960s. Ranganathan (1948)4 coined the term librametry to denote measurement of various library activities and services using mathematical and statistical techniques. Alan Prichard (1969)5 coined the term bibliometric to denote the application of mathematical and statistical methods to books and other media, the process of written communication, and of the nature and course of a discipline. Van Raan (1997)6 According to scientometric research is devoted to Quantitative studies of science and technology. So this paper aims to analyze the contribution of many Scientometrics studies that have appeared in the literature to focus on the performance of science in the field of diabetic’s research in India.
Literature Review
Rajendran et al. (2013)7 examine the Indian research publications in wireless communication research during 2001-2012 from the SCOPUS database with 1128 publications. The study analysis the Scientometrics tools such as, the relative growth rate is 0.56 in the year 2002 and 0.26 in the year 2012. At the same time, doubling time is found that 1.24 in the year 2002 and 2.67 in the year 2012. An average degree of collaboration is 0.95, the CAI increased for double authors from 74 in the first block years to 103 in the second block years. On the other hand, it is decreased from the first block years to the second block years for single and multi-authors.
Vivekanandhan et al. (2016)8 analyzed the pollution control research output from the SCOPUS database during the period of 1985-2014. They analyzed scientometric tools such as authorship pattern, Citation index, Collaborative coefficient, modified collaborative coefficient, and block year-wise publications. The maximum number of 13692 (25.43%) publications is contributed in the 6th block of 2010-2014 and block year wise average degree of collaboration was 0.72. The maximum number of articles was contributed in the journal of water science and technology with a count of 1533 (11.61%) publications, the study, the United States provides a maximum number of 14689 (27.28%) research publications.
Batcha & Ahmad, (2017)9 analyzed the publications trend in the India journal and Pakistan journal: A comparative analysis using the scientometrics approach. The Pakistan Journal of library and information science is concerned with the maximum number of papers published in 2016 and the minimum in 2011. The highest number of research papers was contributed by multiple authors during the study period. The degree of collaboration was 0.69. It is found that the average value for CAI was around 100 during the study period and it reflects the world average. The author productivity is 0.50 and the average number of authors per paper is 1.98. The average number of pages per paper is 10.05. The average keywords per paper are 4.45. The majority of the contributions are by Pakistani authors (77.05%). The papers by Pakistani authors with foreign collaboration are minimal (4.10% of articles).
Batcha, Jahina, & Ahmad, (2018)10 analyzed the publications trend in DESIDOC Journal of Library and information technology during 2013-2017: Ascientometric approach. The DESIDOC Journal of Library and information technology was in the year 2014 and the total number of articles at the highest was accounted for 63. The extent of research contribution by the authors is explained under the authorship pattern and it was found that out of 227 articles, the average degree of collaboration at 0.69. The total average number of authors per paper found in the study was 9.65 and the average productivity per author was 2.59. The exponential growth rate was found to be 4.85 and also CAGR calculated was 9.1% which shows a developmental sign of activity. The period has witnessed a mean relative growth rate of 0.61. The mean doubling time for publications for the periods of 2013-2017 was 1.78.
Ahmad, Batcha, & Jahina, (2019)11 quantitatively measured the research productivity in the area of artificial intelligence at the global level over the study period of ten years (2008-2017). The study acknowledged the trends and features of growth and collaboration pattern of artificial intelligence research output. The average growth rate of artificial intelligence per year increases at the rate of 0.862. The multi-authorship pattern in the study is found high and the average number of authors per paper is 3.31. Collaborative Index is noted to be the highest range in the year 2014 with 3.50. The mean CI during the period of study is 3.24. This is also supported by the mean degree of collaboration at the percentage of 0.83. The mean CC observed is 0.4635.
Ravichandran and Vivekanandhan (2021)12 have examined the wireless network research Output in India from Scopus Database during 2010-2019: A Scientometric Analysis. The study, maximum of 1561(18.24%) publications in the year 2019, CAGR is 35.98. and the total number of citations is 25558. The relative growth rate is 0.91 in the year 2011 and 0.20 in the year 2019. At the same time, doubling time is found that 0.76 in the year 2011 and 3.44 in the year 2019. The average degree of collaboration is 0.96. The maximum of 43(11.53%) papers are published by the author of Tamma, B.R. Time series analysis study will be expected in the wireless network research publications in India in the year 2025 is around are equal to 1986 and the year 2030 is around are equal to 2551.
Objectives
1. To examine the growth of diabetics research output of India during 2071 to 2020.
2. To determine the relative growth rate, doubling time.
3. To analysis the authorship pattern.
4. To analysis the degree of collaboration and co-authorship index.
5. To find out collaborative co-efficient and collaboration index.
6. To find out the top 10 authors and subject contribution.
7. To find out organizations, and top research journals in the field of diabetics in India.
8. To find out top research country in the field of diabetics in India.
9. To find out the time series analysis.
Methodology
This study analysis the diabetics research publications from India based on the publications are downloaded from SCOPUS database for fifty years. The total study periods are divided into 10 blocks year period. The search key is: (TITLE-ABS-KEY ("Diabetics") AND PUBYEAR>1970 AND PUBYEAR<2021 AND (LIMIT-TO (AFFILCOUNTRY,"India”))) were obtained from the SCOPUS database were analyzed. Total number of 19756 research publications is identified between the years 1971-2020. The data has been downloaded on 18.06.2021.
Collected data has been analyzed using Microsoft excel.
Data analysis
Block year wise quantum of publications: Table 1 reveals that block year wise quantum of diabetics research output from India during the period 1971-2020 with 19756 research publications.
| S.No | Block year | No. of publications | % | Cumulative | % |
|---|---|---|---|---|---|
| 1 | 1971-1975 | 109 | 0.55 | 109 | 0.55 |
| 2 | 1976-1980 | 148 | 0.75 | 257 | 1.30 |
| 3 | 1981-1985 | 126 | 0.64 | 383 | 1.94 |
| 4 | 1986-1990 | 201 | 1.02 | 584 | 2.96 |
| 5 | 1991-1995 | 314 | 1.59 | 898 | 4.55 |
| 6 | 1996-2000 | 513 | 2.60 | 1411 | 7.14 |
| 7 | 2001-2005 | 1123 | 5.68 | 2534 | 12.83 |
| 8 | 2006-2010 | 2715 | 13.74 | 5249 | 26.57 |
| 9 | 2011-2015 | 6184 | 31.30 | 11433 | 57.87 |
| 10 | 2016-2020 | 8323 | 42.13 | 19756 | 100.00 |
| Total | 19756 | 100.00 |
Table 1: Growth of Literature in Diabetics-India
Table 2 shows that, the year’s wise growth of research publications in diabetics during the fifty year study period between 1971 and 2020 with 19756 research publications in India. From the study, it is identified that the maximum of 8323(42.13%) research publications are contributed in the years 2016-2020, followed by 6184(31.30%) publications in the years 2011-2015, and 2715(13.74) publications in the years 2006-2010. The average research publications per year for the fifty year study period are 1975.6 publications. This study identified that the growth of research publications in diabetics is increasing and decreasing trend.
| S. No. | Years | No. of publications | Cumulative total | Loge 1 | Loge 2 | RGR | DT |
|---|---|---|---|---|---|---|---|
| 1 | 1971-1975 | 109 | 109 | 4.69 | |||
| 2 | 1976-1980 | 148 | 257 | 4.69 | 5.55 | 0.86 | 0.81 |
| 3 | 1981-1985 | 126 | 383 | 5.55 | 5.95 | 0.40 | 1.74 |
| 4 | 1986-1990 | 201 | 584 | 5.95 | 6.37 | 0.42 | 1.64 |
| 5 | 1991-1995 | 314 | 898 | 6.37 | 6.80 | 0.43 | 1.61 |
| 6 | 1996-2000 | 513 | 1411 | 6.80 | 7.25 | 0.45 | 1.53 |
| 7 | 2001-2005 | 1123 | 2534 | 7.25 | 7.84 | 0.59 | 1.18 |
| 8 | 2006-2010 | 2715 | 5249 | 7.84 | 8.57 | 0.73 | 0.95 |
| 9 | 2011-2015 | 6184 | 11433 | 8.57 | 9.34 | 0.78 | 0.89 |
| 10 | 2016-2020 | 8323 | 19756 | 9.34 | 9.89 | 0.55 | 1.27 |
| Total | 19756 | 62.36 | 72.25 | 5.20 | 11.62 |
Table 2: Relative Growth Rate and Doubling Time
Relative growth rate of publications: The growth of publications was analyzed by using two parameter namely relative growth rate and doubling time by Mahapatra (1985)13. RGR is a measure to study the increases in number of articles in a particular period of time. It is calculated as
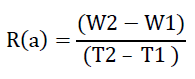
Where,
R (a)=RGR=the mean relative growth rate over the specific period of interval
W1=the logarithm of beginning number of publications/pages
W2=the logarithm of ending number of publications/pages after a specific period of interval
T2-T1=the unit difference between the beginning time and the ending time.
The doubling time is the time taken for the doubling of the number of records actually published within a stipulated period. The doubling time is calculated from the relative growth rate and the natural logarithm number is used, the difference has a value of 0.693. Thus the corresponding doubling time can be calculated by the following formula,
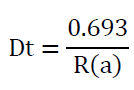
The relative growth rate (RGR) and the doubling time (DT) was calculated and the result are present in Table 3. From the study it is identified from the Table 3, the relative growth rate is 0.86 in the years 1976-1980 and 0.55 in the years 2016-2020. This study confirmed that relative growth rate is decreasing trend. At the same time doubling time found that 0.81 in the years 1976-1980 and 1.27 in the years 1916-2020 and it is conformed that doubling time is increasing trend.
| Sl. No | Forms | No. of publications | Percentage |
|---|---|---|---|
| 1 | Article | 15778 | 79.86 |
| 2 | Review | 1732 | 8.77 |
| 3 | Conference paper | 1162 | 5.88 |
| 4 | Letter | 464 | 2.35 |
| 5 | Book chapter | 282 | 1.43 |
| 6 | Editorial | 120 | 0.61 |
| 7 | Note | 116 | 0.59 |
| 8 | Short survey | 52 | 0.26 |
| 9 | Erratum | 21 | 0.11 |
| 10 | Book | 14 | 0.07 |
| 11 | Retracted | 7 | 0.04 |
| 12 | Data paper | 6 | 0.03 |
| 13 | Undefined | 2 | 0.01 |
| Total | 19756 | 100.00 |
Table 3: Document Types of Research Publications
From the Table 4 shows that, document types it is identified that maximum of 15778(79.86%) research publications are contributed by article, followed by 1732(8.77%) research publication are review and third placed in with conference paper 1162(8.88%) research publications. This study confirmed that 80% of research publications are contributed by article, conference paper and review. Remaining nearby 15 of research publications are identified in the form of letter book chapter, editorial, note, short survey, erratum, book, retracted, data paper, and undefined.
| Authorship pattern | |||||||
|---|---|---|---|---|---|---|---|
| Block Years | 1 | 2 | 3 | 4 | 5 | >5 | Total |
| 1971-1975 | 28 | 27 | 34 | 17 | 1 | 2 | 109 |
| 1976-1980 | 21 | 46 | 56 | 23 | 1 | 1 | 148 |
| 1981-1985 | 11 | 29 | 53 | 22 | 4 | 7 | 126 |
| 1986-1990 | 16 | 36 | 51 | 37 | 34 | 27 | 201 |
| 1991-1995 | 24 | 65 | 70 | 85 | 43 | 27 | 314 |
| 1996-2000 | 39 | 111 | 126 | 85 | 78 | 74 | 513 |
| 2001-2005 | 71 | 238 | 272 | 189 | 144 | 209 | 1123 |
| 2006-2010 | 115 | 524 | 606 | 544 | 390 | 536 | 2715 |
| 2011-2015 | 257 | 1255 | 1390 | 1217 | 794 | 1271 | 6184 |
| 2016-2020 | 241 | 1735 | 1589 | 1540 | 1068 | 2150 | 8323 |
| Total | 823 | 4066 | 4247 | 3759 | 2557 | 4304 | 19756 |
| % | 4.17 | 20.58 | 21.50 | 19.03 | 12.94 | 21.79 | 100.00 |
Table 4: Block Year Wise Authorship Pattern
Table 5 shows that single, double, three, four, five and more than five authored publications. More than five authorship contribution is 4304 (21.79%) of the total research literature output registering in impressive majority while three authorship contribution is 4247(21.50%) Single authored publications record 823 (4.17) which is found to be smaller when compared to the other categories of authorship.
| Sl. No | Block year | Single author publications Ns | Multi author publications Nm | Total publications | Degree of collaborations DC=Nm/(Ns+Nm) |
|---|---|---|---|---|---|
| 1 | 1971-1975 | 28 | 81 | 109 | 0.74 |
| 2 | 1976-1980 | 21 | 127 | 148 | 0.86 |
| 3 | 1981-1985 | 11 | 115 | 126 | 0.91 |
| 4 | 1986-1990 | 16 | 185 | 201 | 0.92 |
| 5 | 1991-1995 | 24 | 290 | 314 | 0.92 |
| 6 | 1996-2000 | 39 | 474 | 513 | 0.92 |
| 7 | 2001-2005 | 71 | 1052 | 1123 | 0.94 |
| 8 | 2006-2010 | 115 | 2600 | 2715 | 0.96 |
| 9 | 2011-2015 | 257 | 5927 | 6184 | 0.96 |
| 10 | 2016-2020 | 241 | 8082 | 8323 | 0.97 |
| Total | 823 | 18933 | 19756 |
Table 5: Block Year Wise Degree of Collaboration
Degree of collaboration is relationship between single author and multi author contributions. The degree of collaboration is calculated by the K. Subramanian (1983)14 formula and used for Ravichandran and Vivekanadhan (2021)15,
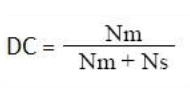
Where DC=Degree of Collaboration
Nm=Number of Multi author publications
Ns=Number of single author publications
In the present study
Nm=18933, Ns=823
So that the degree of collaboration=18933/(18933+823)=0.95
Table 6 shows that the degrees of collaboration in the field of diabetics research publications for Fifty year study period. From the study it is identified that, the degree of collaboration is between 0.74 in the years 1971-1975 and 0.97 in the years 2016-2020. The average degree of collaboration is 0.95. From this study it is identified that majority of diabetic research publications are contributed by collaborative authors in CAI=100 indicates that a countries coauthorships effort for a particular type of authorship is correspondents to the world average. CAI>100 reflects higher than the average co-authorship effort and CAI<100 shows that lower than average co-authorship effort for a given type of authorship pattern.
| Sl. No | Year | Single authors | CAI | Two authors | CAI | Three author | CAI | More than three authors | CAI | Total |
|---|---|---|---|---|---|---|---|---|---|---|
| 1 | 1971-1975 | 28 | 616.64 | 27 | 120.36 | 34 | 145.10 | 20 | 34.13 | 109 |
| 2 | 1976-1980 | 21 | 340.61 | 46 | 151.02 | 56 | 176.01 | 25 | 31.42 | 148 |
| 3 | 1981-1985 | 11 | 209.57 | 29 | 111.83 | 53 | 195.67 | 33 | 48.72 | 126 |
| 4 | 1986-1990 | 16 | 191.08 | 36 | 87.02 | 51 | 118.03 | 98 | 90.70 | 201 |
| 5 | 1991-1995 | 24 | 183.48 | 65 | 100.58 | 70 | 103.70 | 155 | 91.83 | 314 |
| 6 | 1996-2000 | 39 | 182.49 | 111 | 105.13 | 126 | 114.25 | 237 | 85.94 | 513 |
| 7 | 2001-2005 | 71 | 151.77 | 238 | 102.97 | 272 | 112.67 | 542 | 89.78 | 1123 |
| 8 | 2006-2010 | 115 | 101.68 | 524 | 93.78 | 606 | 103.83 | 1470 | 100.72 | 2715 |
| 9 | 2011-2015 | 257 | 99.76 | 1255 | 98.61 | 1390 | 104.56 | 3282 | 98.73 | 6184 |
| 10 | 2016-2020 | 241 | 69.51 | 1735 | 101.29 | 1589 | 88.81 | 4758 | 106.35 | 8323 |
| Total | 823 | 4066 | 4247 | 10620 | 19756 |
Table 6: Co-Authorship Index (CAI) in Research Publications
Co-authorship index: Co-authorship index (CAI) is obtained by calculating proportionally the publications by single, two, three and multi authored papers Garg & Padhi, (1999)16.
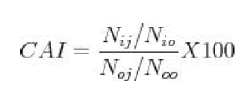
Where,
Nij=Number of papers having authors in block i
Nio=Total output of block i
Noj=Number of papers having j authors for all blocks.
Noo=Total number of papers for all authors and all blocks
Collaborative Co-efficient (CC): The pattern of co-authorship collaboration among the authors can be measured with the following formula suggested by Ajiferuke, et al. (1988)17
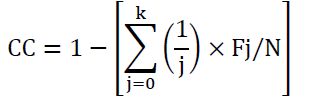
Whereas,
Fj=Number of publications with j author papers
N=Total number of the research publications and
k=the greatest number of authors/paper in the given field.
Collaboration Index (CI): The simple indicator are presently employed in the publications to the collaboration index, which is to be understand nearly as the mean number of authors per paper are suggested by Ajiferuke, et al.(1988)17
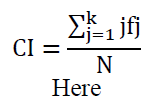
J-The number of co-authored papers appearing in a discipline.
N-The total number of publications in the field over the same time period of interval and
k-The highest number of authors per paper in a same time field.
Table 7 for calculation the co-authorship index for authors, countries have been replaced with block. For this study, the authors have been classified into four blocks. Vs. single, two, three, and more than three authors and period of the study has been divided into 10 blocks from 1971- 2020.
| Authorship Pattern | ||||||||
|---|---|---|---|---|---|---|---|---|
| Block Years | 1 | 2 | 3 | 4 | 5 | 6 | CI | CC |
| 1971-1975 | 28 | 27 | 34 | 17 | 1 | 2 | 2.47 | 0.47 |
| 1976-1980 | 21 | 46 | 56 | 23 | 1 | 1 | 2.59 | 0.54 |
| 1981-1985 | 11 | 29 | 53 | 22 | 4 | 7 | 3.00 | 0.60 |
| 1986-1990 | 16 | 36 | 51 | 37 | 34 | 27 | 3.59 | 0.64 |
| 1991-1995 | 24 | 65 | 70 | 85 | 43 | 27 | 3.44 | 0.64 |
| 1996-2000 | 39 | 111 | 126 | 85 | 78 | 74 | 3.53 | 0.64 |
| 2001-2005 | 71 | 238 | 272 | 189 | 144 | 209 | 3.64 | 0.65 |
| 2006-2010 | 115 | 524 | 606 | 544 | 390 | 536 | 3.80 | 0.68 |
| 2011-2015 | 257 | 1255 | 1390 | 1217 | 794 | 1271 | 3.78 | 0.67 |
| 2016-2020 | 241 | 1735 | 1589 | 1540 | 1068 | 2150 | 3.95 | 0.69 |
| Total | 823 | 4066 | 4247 | 3759 | 2557 | 4304 | ||
Table 7: Collaborative Co-Efficient and Collaboration Index Research Publications
Table 8 shows that, collaborative measures of diabetics’ research publications in India for the selected fifty year study period from 1971-2020. From the study it is identified that, the maximum of collaborative co-efficient value is 0.69 in the years 2016-2020 and a minimum of collaborative co-efficient value is 0.47 in the years 1971-1975. The average collaborative coefficient value is 0.62. The collaboration index values are identified from Table 8, maximum of collaboration index value is 3.95 in the years 2016-2020 and minimum of collaboration index value is 2.47 in the years 1971-1975. During the study period the average collaboration index value is 3.38.
| S.No | Authors | Publications | % |
|---|---|---|---|
| 1 | Mohan, V. | 303 | 23.18 |
| 2 | Ramachandran, A. | 162 | 12.39 |
| 3 | Kalra, S. | 138 | 10.56 |
| 4 | Viswanathan, V. | 124 | 9.49 |
| 5 | Raman, R. | 121 | 9.26 |
| 6 | Snehalatha, C. | 110 | 8.42 |
| 7 | Pari, L. | 102 | 7.80 |
| 8 | Bhansali, A. | 98 | 7.50 |
| 9 | Sharma, T. | 80 | 6.12 |
| 10 | Ahmad, J. | 69 | 5.28 |
| Total | 1307 | 100.00 |
Table 8: Top 10 Author Wise Contributions Research Contributions
Table 9 identified the top ten author contributions for the research publications of diabetic’s research from SCOPUS database. From the study it is identified that, maximum of 303(23.18%) research publications are contributed by Mohan, V., followed by Ramachandran, A. with 162(12.39%) research publications, Kalra, S.with 138(10.56%) research publications. From this study it is identified that 1307(100%) research publications are contributed by the top ten authors.
| S.No | Organizations | Publications | % |
|---|---|---|---|
| 1 | All India Institute of Medical Sciences, New Delhi | 597 | 18.27 |
| 2 | Postgraduate Institute of Medical Education & amp; Research, Chandigarh | 456 | 13.95 |
| 3 | Annamalai University | 413 | 12.64 |
| 4 | Manipal Academy of Higher Education | 354 | 10.83 |
| 5 | University of Madras | 295 | 9.03 |
| 6 | Madras Diabetes Research Foundation | 287 | 8.78 |
| 7 | Kasturba Medical College, Manipal | 240 | 7.34 |
| 8 | Jamia Hamdard | 217 | 6.64 |
| 9 | SRM Institute of Science and Technology | 206 | 6.30 |
| 10 | Vellore Institute of Technology | 203 | 6.21 |
| Total | 3268 | 100.00 |
Table 9: Top 10 Organization Contributions Research Publications
Table 10 identified the top ten organizations contributions for diabetics’ research from SCOPUS database. From the study it is identified that, maximum of 597(18.27%) research publications are contributed by All India institute of medical sciences, New Delhi, followed by postgraduate institute of medical education & amp; Research, Chandigarh, with 456(13.95%) research publications and Annamalai University with 413(12.64%) research publications. From this study it is identified that 3268(100%) research publications are contributed by the top ten organizations.
| S.No | Journals | Publications | % |
|---|---|---|---|
| 1 | Journal of Association of Physicians of India | 362 | 14.39 |
| 2 | Journal of Clinical and Diagnostic Research | 321 | 12.76 |
| 3 | International Journal of Pharmacy and Pharmaceutical Sciences | 266 | 10.58 |
| 4 | Diabetes and Metabolic Syndrome Clinical Research and Reviews | 263 | 10.46 |
| 5 | Asian Journal of Pharmaceutical and Clinical Research | 262 | 10.42 |
| 6 | International Journal of Diabetes In Developing Countries | 249 | 9.90 |
| 7 | International Journal of Pharma and Bio Sciences | 212 | 8.43 |
| 8 | Research Journal of Pharmaceutical Biological and Chemical Sciences | 198 | 7.87 |
| 9 | Indian Journal of Ophthalmology | 197 | 7.83 |
| 10 | Journal of the Indian Medical Association | 185 | 7.36 |
| Total | 2515 | 100.00 |
Table 10: Top 10 Journals Contributions Research Publications
Table 11 identified the top ten Journals research publications of diabetics research from SCOPUS database.
| S.No | Country | Publications | % |
|---|---|---|---|
| 1 | United States | 1010 | 35.84 |
| 2 | United Kingdom | 394 | 13.98 |
| 3 | Saudi Arabia | 305 | 10.82 |
| 4 | Malaysia | 218 | 7.74 |
| 5 | Australia | 205 | 7.27 |
| 6 | Canada | 154 | 5.46 |
| 7 | South Korea | 149 | 5.29 |
| 8 | Italy | 133 | 4.72 |
| 9 | Germany | 126 | 4.47 |
| 10 | China | 124 | 4.40 |
| Total | 2818 | 100.00 | |
| Other Country 121 | 2281 | ||
| Total country publications | 5099 |
Table 11: Top 10 Collaborative Country Research Publications
From the study it is identified that, maximum of 362(14.39) research publications are contributed by Journal of association of physicians of India, followed by Journal of clinical and diagnostic research with 321(12.76%) research publications and International journal of pharmacy and pharmaceutical sciences with 266(10.58%) research publications.
From this study it is identified that 2515(100%) research publications are contributed by the top ten journals.
Time series analysis reveals the estimated growth values are identified based on previous data. A straight line equation is adapted to measure the future values based on previous data. Time series analysis used by Jeyshankar and Ramesh babu (2013)18 Ravichandran and Vivekanandhan (2020)19
Table 12 identified the top ten collaborative country wise research publications of diabetics’ research from SCOPUS database. From the study it is identified that, maximum of 1010 (35.84%) research publications are contributed by United States, followed by United Kingdom with 394(13.98%) research publications and Saudi Arabia with 305(10.82%) research publications. From this study it is identified that total number of collaborative of 121 countries are collaborated by 5099 publications.
| S. No | Block year | Count (Y) | X | X2 | XY |
|---|---|---|---|---|---|
| 1 | 1971-1975 | 111 | 0 | 0 | 0 |
| 2 | 1976-1980 | 148 | 1 | 1 | 148 |
| 3 | 1981-1985 | 126 | 2 | 4 | 252 |
| 4 | 1986-1990 | 201 | 3 | 9 | 603 |
| 5 | 1991-1995 | 314 | 4 | 16 | 1256 |
| 6 | 1996-2000 | 513 | 5 | 25 | 2565 |
| 7 | 2001-2005 | 1123 | 6 | 36 | 6738 |
| 8 | 2006-2010 | 2715 | 7 | 49 | 19005 |
| 9 | 2011-2015 | 6184 | 8 | 64 | 49472 |
| 10 | 2016-2020 | 8323 | 9 | 81 | 74907 |
| Total | 19758 | 45 | 285 | 154946 |
Table 12: Time Series Analysis
Table 12 shows that the time series analysis formula has been predicted for diabetics research publications for the year 2025 and 2030
Straight Line Equation is
Y=a+bx
Here,
ΣY=19758, ΣX2=285, ΣXY=154946
a=ΣY/N=19758/10=1975.8=1976
b=ΣXY/ΣX2=154946/285=543.6=544
Estimated publications in the year 2025 is when X=2025-1971=54
Y=a+bx
=1976+(544*54)=1976+29376=31352
Estimated literature in 2030 is when X=2030-1971=59
Y=a+bx
=1976+(544*59)=1976+32096=34072
The estimated growth based on a time series analysis statistical application will be expected in the diabetics research publications in the year 2025 is around are equal to 31352 and the year 2030 is around are equal to 34072. So that time serious analysis conformed that the publications on diabetic’s research is increasing trend.
Results and Discussion
1. The year wise growth of research publications in diabetics during the fifty year study period between 1971-2020 with 19756 research publications. From the study, it is identified that the maximum of 8323(42.13%) research publications are contributed in the years 2016-2020, followed by 6184(31.30%) publications in the years 2011-2015, and 2715(13.74) publications in the years 2006-2010. The average research publications per year for the fifty year study period is 1975.6 publications
2. The relative growth rate is 0.86 in the years 1971-1975 and 0.55 in the years 2016-2020. This study confirmed that relative growth rate is decreasing trend. At the same time doubling time found that 0.81 in the years 1971-1975 and 1.27 in the years 2016-2020 and it is conformed that doubling time is increasing trend.
3. Maximum of 15778(79.86%) research publications are contributed by article, followed by 1732(8.77%) research publication are review and third placed in with conference paper 1163(8.88%) research publications. This study confirmed that 80% of research publications are contributed by article.
4. The more than five authorship pattern 21.79% of the total research literature output registering in impressive majority while double authorship pattern 20.58%. And the degree of collaboration is between 0.74 in the years 1971-1975 and 0.97 in the years 2016-2020. The average degree of collaboration is 0.95.
5. The value of CAI for three authored papers was the highest with 4247 and the value of CAI for two authored papers was 4066, Single authored papers 823, which indicated that the collaborative research is increasing in the diabetic’s research.
6. The study of maximum of collaboration coefficient value is 0.69 in the years 2016-2020 and a minimum of collaborative coefficient value is 0.47 in the year 1971-1975. The average collaborative coefficient value is 0.62. The collaboration index values are maximum of 3.95 in the years 2016-2020 and minimum of collaboration index value is 2.47 in the year 1971-1975. The average collaboration index value is 3.38.
7. The authors the maximum of 303(23.18%) research publications are contributed by Mohan, V., followed by Ramachandran, A. with 162(12.39%) research publications, Kalra, S.with 138(10.56%) research publications.
8. The study of Organization of the maximum of 597(18.27%) research publications are contributed by All India Institute of Medical Sciences, New Delhi, followed by Postgraduate Institute of Medical Education & amp; Research, Chandigarh, with 456(13.95%) research publications and Annamalai University with 413(12.64%) research publications.
Conclusion
The Journals the maximum of 362(14.39) research publications are contributed by Journal of association of physicians of India, followed by Journal of clinical and diagnostic Research with 321(12.76%) research publications and International Journal of Pharmacy And Pharmaceutical Sciences, with 266(10.58%) research publications. From the collaborated countries, maximum of 1010(35.84%) research publications are collaborated country by United States, followed by United Kingdom with 394(13.98%) research publications and Saudi Arabia with 305(10.87%) research publications. The time series analysis statistical application will be expected in the diabetics research publications in the year 2025 is around are equal to 31352 and the year 2030 is around are equal to 34072. So that time serious analysis conformed that the publications on diabetics’ research is increasing trend.
References
- "Diabetes: An Introduction." Caregivers Resources (2021).
- Cole, Francis Joseph, and Nellie B. Eales. "The history of comparative anatomy: Part I.—A statistical analysis of the literature." Science Progress (1916-1919) 11.44 (1917): 578-596.
[Crossref] [GoogleScholar] [PubMed]
- Hulme Hulme, Edward Wyndham. "Statistical bibliography in relation to the growth of modern civilization." 112 (1923): 584-585.
[Crossref] [GoogleScholar] [PubMed]
- Ranganathan, S. R. "Library and its scope Bangalore DRTC Seventh seminar volume paper DA." International journal of scientometrics and info metrics 1.1 (1995): 15-21.
[Crossref] [GoogleScholar] [PubMed]
- Prichard A. "Statistical Bibliography of Bibliographies." Journal of Documentation 25.4 (1969): 348-349.
[Crossref] [GoogleScholar] [PubMed]
- Van Raan, A. "Scientometrics: State-of-the-art." Scientometrics 38.1 (1997): 205-218.
[Crossref] [GoogleScholar] [PubMed]
- Rajendran, P., J. Manickaraj, and B. Elango. "Scientometric Analysis of India’s Research Output on Wireless Communication." Journal of advances in Library and Information Science 2.3 (2013): 105-111.
[Crossref] [GoogleScholar] [PubMed]
- Batcha, M. Sadik, and Muneer Ahmad. "Publication Trend in an Indian Journal and a Pakistan Journal: A Comparative Analysis using Scientometric Approach." arXiv preprint arXiv:2102.12914 (2021).
[Crossref] [GoogleScholar] [PubMed]
- Batcha, M. Sadik, S. Roselin Jahina, and Muneer Ahmad. "Publication Trend in DESIDOC Journal of Library and Information Technology during 2013-2017: A Scientometric Approach." International Journal of Research in Engineering, IT and Social Sciences 8.4 (2018): 76-82.
[Crossref] [GoogleScholar] [PubMed]
- Ahmad, Muneer, Dr M. Sadik Batcha, and S. Roselin Jahina. "Testing Lotka's law and pattern of author productivity in the scholarly publications of artificial intelligence." arXiv preprint arXiv:2102.09182 (2021).
[Crossref] [GoogleScholar] [PubMed]
- Ravichandran Shanmugam, Ravichandran. "Wireless Network Research Output in India from Scopus Database during 2010-2019: A Scientometric Analysis." (2021).
[Crossref] [GoogleScholar] [PubMed]
- Mahapatra, M. "On the validity of the theory of exponential growth of scientific literature." Proceedings of the 15th IASLIC conference, Bangalore. Vol. 6170. 1985.
[Crossref] [GoogleScholar] [PubMed]
- Subramanyam, Krishnappa. "Bibliometric studies of research collaboration: A review." Journal of information Science 6.1 (1983): 33-38.
[Crossref] [GoogleScholar] [PubMed]
- Ravichandran, S., and S. Vivekanandhan. "Scientometric analysis of waste water management research publications from SCOPUS database during 2010-2019." Library Philosophy and Practice (2021): 1-17.
[Crossref] [GoogleScholar] [PubMed]
- Garg, K.C and Padhi, P. "Scientometrics of laser research literature as viewed through the Journal of Current Laser Abstracts." Scientometrics, 45.2 (1999): 251-268.
[Crossref] [GoogleScholar] [PubMed]
- Ajiferuke, I. and Tauge, J. "Collaborative Co-efficient: A single measure of the degree of collaboration in research." Scientometrics, 14 (1988):421-433.
[Crossref] [GoogleScholar] [PubMed]
- Jeyshankar, R., and B. Ramesh Babu. "Scientometric Analysis of Leukemia Research output 1960-2011: An Indian perspective." Asia Pacific Journal of Library and information science, 3.2 (2013): 1-16.
[Crossref] [GoogleScholar] [PubMed]
- Ravichandran and Vivekanandhan. "Bibliometric Analysis of Solid Waste Management Research Publications (2010-2019) using SCOPUS Database." International Journal of Library and Information Studies, 10.4 (2020): 2231-4911.
[Crossref] [GoogleScholar] [PubMed]
Author Info
S. Ravichandran* and S. Vivekananda*Received: 21-Feb-0222, Manuscript No. IJLIS-22-54003; Editor assigned: 28-Feb-2022, Pre QC No. IJLIS-22-54003(PQ); Reviewed: 14-Mar-2022, QC No. IJLIS-22-54003; Revised: 21-Mar-2022, Manuscript No. IJLIS-22-54003(R); Published: 31-Mar-2022, DOI: 10.35248/2231-4911.22.12.824
Copyright: This is an open access article distributed under the terms of the Creative Commons Attribution License, which permits unrestricted use, distribution, and reproduction in any medium, provided the original work is properly cited.
Call for Papers
Authors can contribute papers on
What is Your ORCID
Register for the persistent digital identifier that distinguishes you from every other researcher.
Social Bookmarking
Know Your Citation Style
American Psychological Association (APA)
Modern Language Association (MLA)
American Anthropological Association (AAA)
Society for American Archaeology
American Antiquity Citation Style
American Medical Association (AMA)
American Political Science Association(APSA)

Google Scholar citation report
Citations : 1680
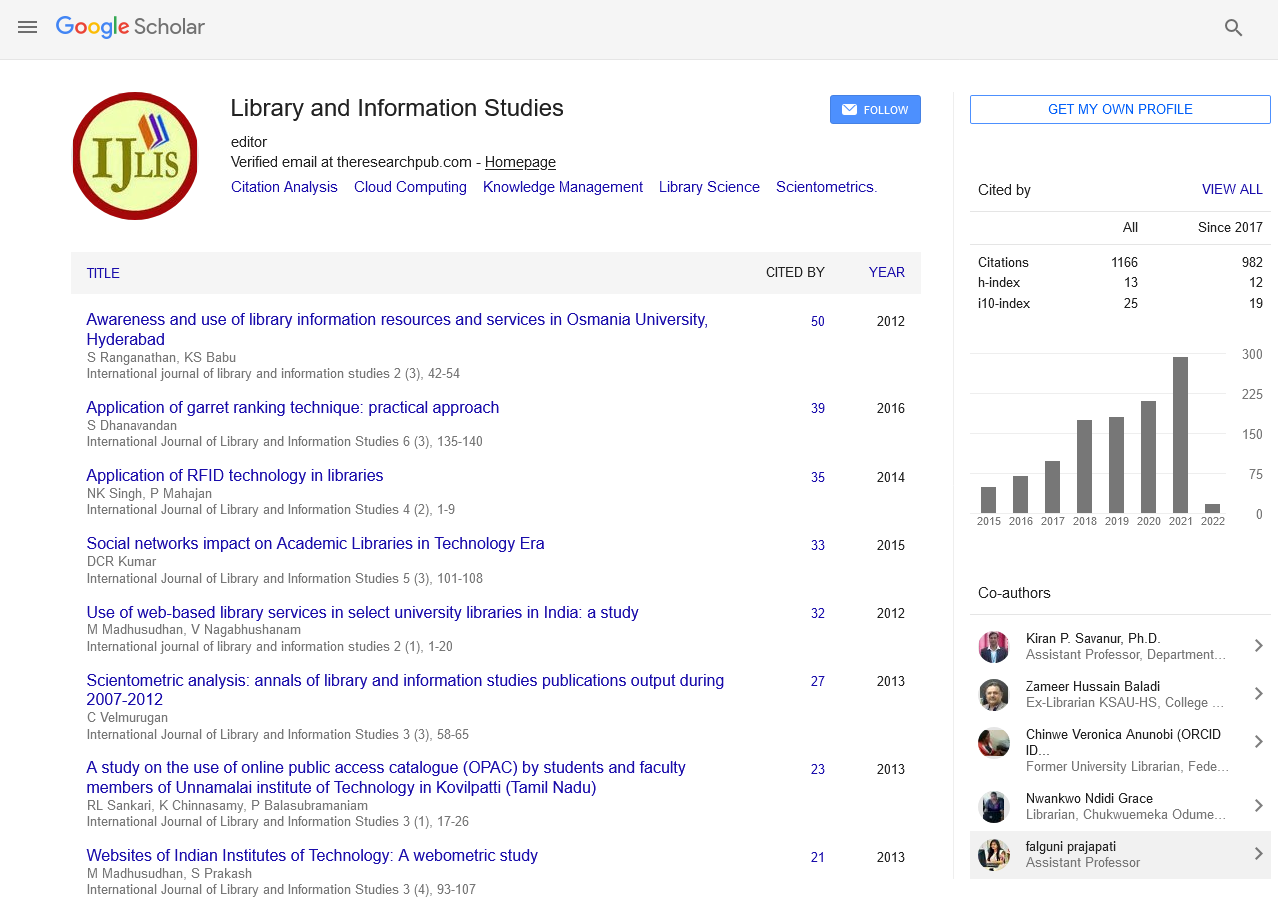
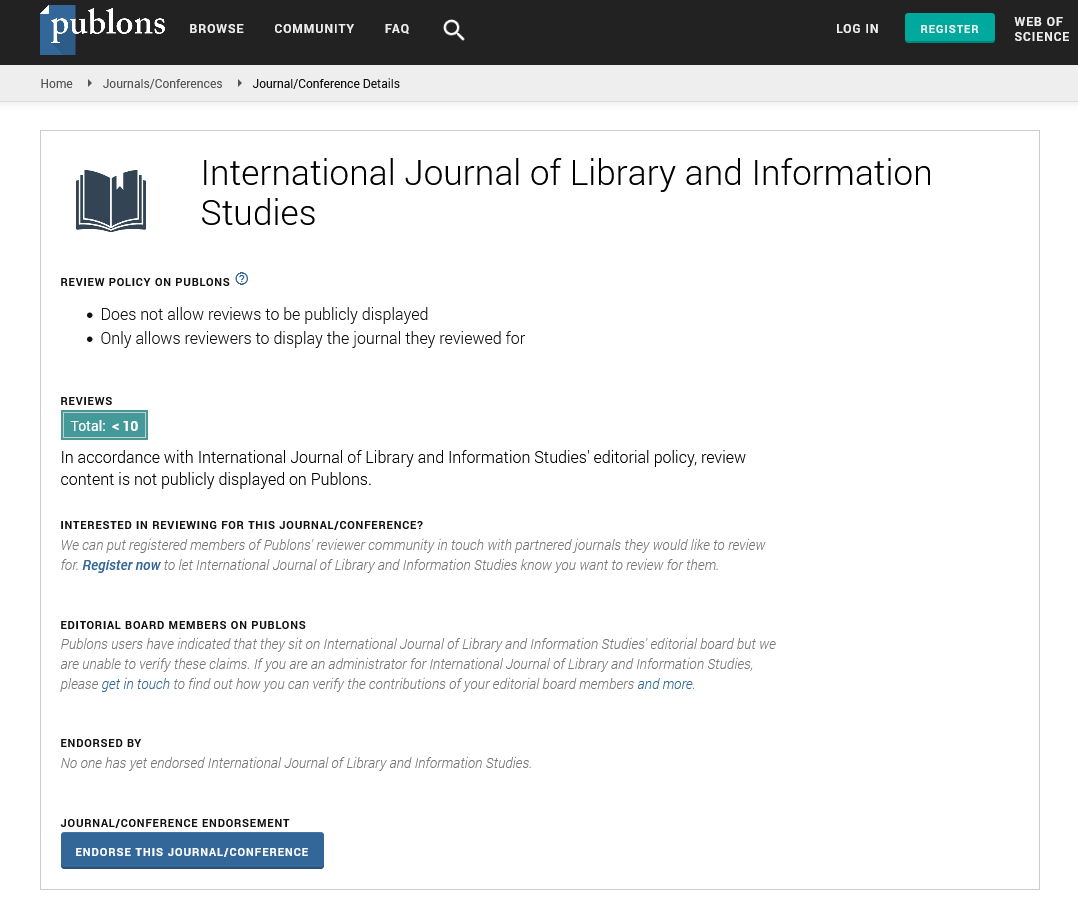
International Journal of Library and Information Studies peer review process verified at publons
Indexed In
Bibliography & Citation Tools