Review Article - (2025) Volume 15, Issue 1
Indian Contribution in Physics (2011-2020): On Web of Science Data Base: A Scientometric Study
Gajbe Sankalp S1* and Sonwane Shashank2Abstract
This paper explores the research trends in terms of growth of literature, geographical distribution, most productive journals and top authors in the field of “Indian Physicists” during the year 2011-2020. A total of 7362 articles for the period of 10 years (2011-2020) were downloaded from Web of Science (WOS) database. Bradford's law of scattering was used to identify core journals in this field respectively. As per rank of the journals, it is found that “Journal of Applied Physics” is the most productive journal with 657 articles (8.93%). It is also observed that distribution of articles is in accordance with Bradford's law of scattering.
References
Blog | Mortgage info in Illinois Best Betting Sites in Portugal Blog | Mortgage info in Nevada Best Betting Sites in New Zealand Best Betting Sites in Brazil Blog | Mortgage info in UK Casino Sites in Belgium Blog | Mortgage Lender in USA Info Crypto Mining Blog | Mortgage rates in USA Best Betting Sites in USA Blog | Lender in USA Auto Insurance in United Kingdom Find Lawyer in Indiana Casino Sites in Brazil Blog | List of Crypto Exchanges Blog | List of Crypto Exchanges Casino Sites in Portugal Blog | OP Systems Blog | Types of AltcoinsKeywords
Bibliometric, Scientrometric, Authoership pattern, Author ranking, Indian Physicists, Bradford's law.
Introduction
Scientrometrics is the use of statistical methods in the analysis of a body of literature to reveal the historical development of subject fields and patterns of authorship, publication, and use. In other words, it is a type of research method used in library and information science. It utilizes quantitative analysis and statistics to describe patterns of publication within a given field or body of literature. Researchers may use scientriometric methods of evaluation to determine the influence of a single writer or to describe the relationship between two or more writers or works. bibliometrics and informetrics share connections and areas of concern with scientometrics. The study of the dynamics of disciplines as they are reflected in the creation of their literature is the subject of the component areas known as bibliometrics, scientometrics, and informetrics [1].
The title of Nalimov's classic monograph, Naukometriy, which was published in 1969, and which was largely obscure to western scholars even after it was translated into English without access to the internet and with limited distribution, is now known as "scientometrics." However, the word gained more popularity after the publication of Scientometrics in 1978 [2].
There are many definition for the term”Scientometrics” in the literature; Scientrometric is the quantitative study of the disciplines of the science based on published literature and communication. This might entail finding new fields of scientific study, analysing how research has evolved over time, or analysing how research is distributed geographically and organizationally [3].
Literature Review
There have been few scientometrics studies conducted on individual journals. Some of the relevant studies in the aforementioned for direction are creditable of review.
Liu, Jiao and Chen, investigated the progress in Diabetic Retinopathy (DR) researches between 2000 and 2010 through bibliometricstudy using ISI Web of Science. By using bibliometric statistical techniques, they looked at the number of papers published each year, authors, source publications, subject category, document type, document language, institution, and country [4].
Chiu and H, conducted a bibliometric study on tsunami related publications in the Science Citation Index (SCI). Documents were evaluated based on their kind, language, publication output, authorship, publication patterns, subject category distribution, and author keyword distribution, country of publication, most frequently referenced publications, and document distribution. The majority of the documents were released in English. The US leads publishing production, followed by Japan, and the majority of the total production was still produced by the seven major industrialised nations. The paper that was published the most frequently was in Pure and Applied Geophysics and the Multidisciplinary Geosciences ISI category [5].
Manikandan, M., and Amsaveni, attempted to quantitatively examine the research trends in management information systems (1989 to 2013). With the use of academic articles found in the well-known database web of science during a 25-year period, the productivity, traits, and many facets of global publication in the subject of management information system research output are studied in this work. The majority of articles are written by teams of two, three, or four authors, which is incredibly beneficial for teamwork. Among the trio of authors who contributed the most. 4.32 percent, discovered in the year 1991, is the exponential growth rate with the highest value [6].
Objective of the study
The main objective of the study is to present the growth of literature, and make Quantitative and qualitative assessment of the research by analyzing the research outputs towards identifying the following facts:
• Year-wise distribution of contribution.
• Year-wise authorship pattern of contribution.
• Relative growth rate and doubling time for publication
• Time series analysis.
• To find out the most productive journals and application of Bradford's law of scattering.
About the database web of science
The web of science, formerly web of knowledge, is a platform with paid access that gives users access to numerous databases that contain reference and citation data from academic journals, conference proceedings, and other publications in a range of academic subjects. The Institute for Scientific Information created it at first. Currently owned by Clarivate, which was once Thomson Reuters' intellectual property and science division [7].
A citation index is based on the idea that in science, citations act as links between related pieces of research and point to relevant or related scientific material, such as journal articles, conference proceedings, abstracts, etc. A citation index also makes it simple to find the literature that has had the greatest influence in a given topic or across multiple disciplines. Linking to all the papers that have mentioned a particular paper, for instance, will show how influential that work is. Current trends, patterns, and newly developing fields of study can all be evaluated in this way. The science citation index, created by Eugene Garfield, is credited as being the "father of citation indexing of academic literature", which eventually gave rise to the web of science.
Discussion
Scope and limitation
This study is limited to the “Indian Physicists” during the year 2011-2020. Total 7362 articles were published during the year 2011-2020 on web of science. The collected data was organized, analyze and generate the tables, using the MS Excel and presented in table, graphs and charts format for final study [8,9].
Data interpretation
In views of the objectives of the present study, analysis the “Indian Physicists” on Web of Science during 2011-2020.
The collected data will be analysised by different scientometric techniques and parameters viz. authorship pattern Citation. Journal Ranking, application of bibliometric laws bradford, etc.
1 year wise citation of article
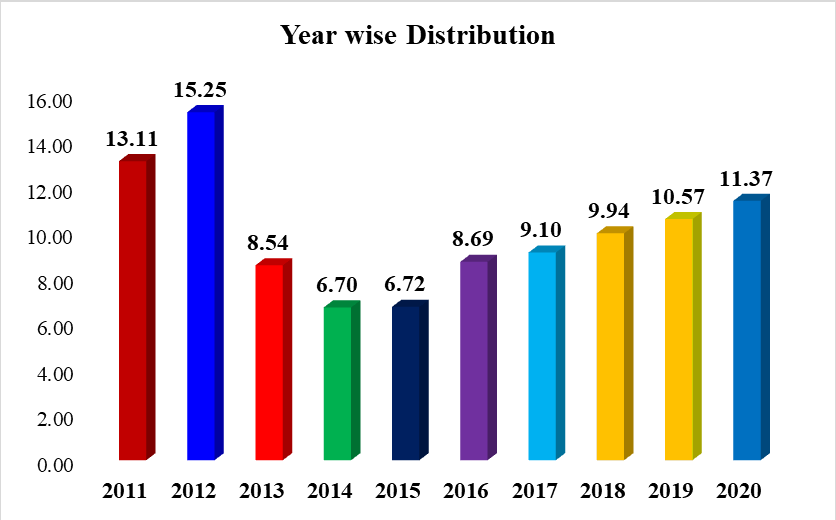
The distribution of research articles on Indian Physicist by year indexed in web of science from 2011-2020. It is clear that the number of research articles has been increased over the months. It is indicates also that of the 7362 articles published in 2012. i.e. (15.25%) has the highest number. While in the other years (84.75%) the lowest number (Figure 1).
Figure 1: Year wise citation of article
Authorship pattern of citations
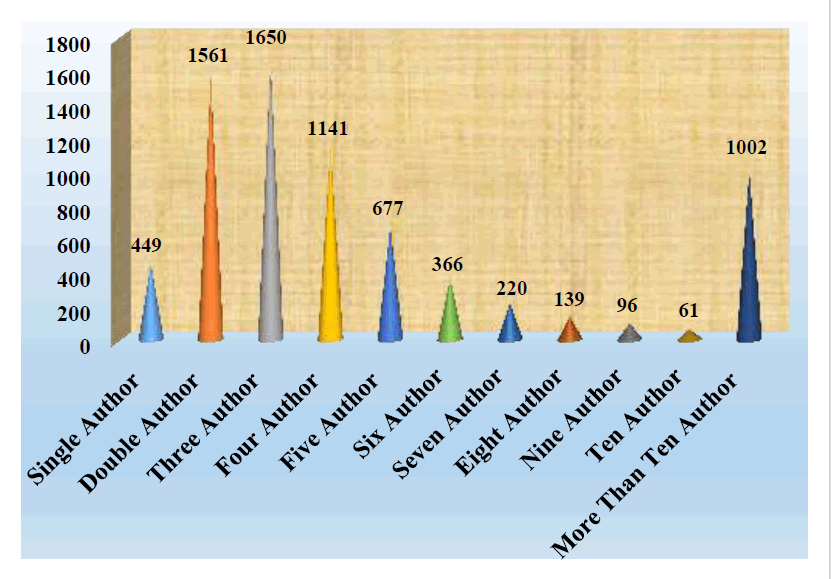
The authorship patterns of citation are arranged as single, two, three, four, five, six, seven, eight, nine, ten and more than ten author. The citations are arranged under each category for counted their percentage in authorship pattern for showing the trends of research as solo or corporate in Indian Physicist research, which is shown in the Figure 2.
Figure 3: Authorship pattern of total citations
It is observed form the above figure that, out of 7362 authors citations, the single author with 449 (6.10%) of total citation, followed by two authors with 1561 (21.20%) citations, three authorship is most prominent with 1650 (22.41%) of total citations, four authors with 1141 (15.50%) citations, five authors with 677 (9.20%) citations, six authors with 366 (4.97%) citations, seven authors with 220 (2.99%) citations, eight authors with 139 (1.89%) citations, nine authors with 96 (1.30%) citations, Ten authors with 61 (0.83%) citations and the more than ten author citations are 1002 (13.61%) citation respectively.
Relative growth rate and doubling time for publication
The growth of literature of information technology and management researchis being measured with the scientometric indicators Relative Growth Rate (RGR) andDoubling Time (Dt). The RGR is obtained with the following formula used byKarpagam R, et al. (Table 1).
R(P)=(Loge2p-Loge1p/2T-1T)
Here R (P)=Relative Growth Rate of articles over the specific period of time.
Loge 1P=Log of initial number of articles.
Loge 2P=Log of final number of articles.
2T–1T=The unit difference between the initial time and final times.
The Dt. is obtained with the following formula;
Dt=0.693/R
| S. no. | Year | T P | Cumulative | Loge 1p | Loge 2p | (R (P)) | Mean | (Dt(p)) | Mean |
|---|---|---|---|---|---|---|---|---|---|
| (R (P)) | (Dt (p)) | ||||||||
| 1 | 2011 | 965 | 965 | 6.8721 | |||||
| 2 | 2012 | 1123 | 2088 | 6.8721 | 7.6440 | 0.7718 | 0.8979 | ||
| 3 | 2013 | 629 | 2717 | 7.6440 | 7.9073 | 0.2633 | 2.6318 | ||
| 4 | 2014 | 493 | 3210 | 7.9073 | 8.0740 | 0.1667 | 4.1561 | ||
| 5 | 2015 | 495 | 3705 | 8.0740 | 8.2174 | 0.1434 | 0.3363 | 4.8322 | 3.1295 |
| 6 | 2016 | 640 | 4345 | 8.2174 | 8.3768 | 0.1593 | 4.3491 | ||
| 7 | 2017 | 670 | 5015 | 8.3768 | 8.5202 | 0.1434 | 4.8324 | ||
| 8 | 2018 | 732 | 5747 | 8.5202 | 8.6564 | 0.1362 | 5.0864 | ||
| 9 | 2019 | 778 | 6525 | 8.6564 | 8.7834 | 0.1270 | 5.4583 | ||
| 10 | 2020 | 837 | 7362 | 8.7834 | 8.9041 | 0.1207 | 0.1373 | 5.7419 | 5.0936 |
Table 1: Relative growth rate and doubling time for publication
The Relative Growth Rate (R (P)) and Doubling Time (Dt (P)) of Publicationin Table 1. It can noticed that the Relative Growth Rate of Publication (R(P)) lightly decrease from the rate of 0.7718 in 2012 to 0.1207 in 2020. The mean relative growth (i.e. 2012 to 2015) showed a growth rate of 0.3363 and (2016 to 2020) 0.1373. The corresponding Doubling Time for different years (Dt (P)) highly increased from 0.8979 in 2012 to 5.7419 in 2020. Thus as the rate of growth of publication was decreased, the corresponding doubling time was increased.
At the same time, the corresponding doubling time for different year gradually increased from 2012 to 2020. The mean doubling time for the first four years (i.e. 2012 to 2015) was only 3.12 which increased to 5.74 during the last ten years (2011 to 2020). As the rate of growth of publication decreased, the corresponding dubling time increased. It could be deduced that in general there is a progressive increase in the number of publication for the study period. However the relative growth rate shows a downwoard trend which mean the rate of increase is proportionally low, and this is higher than relative Growth Rate. The mean relative growth of Indian Physicist article has shown a declining trend. Consequently, mean doubling time has increased.
Time series analysis
A time series is a series of data points listed or graphed in time order. The time series is a sequence taken at consecutive equally spread out points in time. Therefore, it is a sequence of discrete-time data. Time series analysis comprises methods for analyzing time series data to extract meaningful statistics and other characteristics of the data. Time series forecasting is the use of a model to predict future values based on previously observed values. In this study time series analysis is applied to forecast the growth of Indian contribution in physics in web of science (Table 2).
| S. no | Year | Paper (Y) | X | X2 | XY |
|---|---|---|---|---|---|
| 1 | 2011 | 965 | -4 | 16 | -3860 |
| 2 | 2012 | 1123 | -3 | 9 | -3369 |
| 3 | 2013 | 629 | -2 | 4 | -1258 |
| 4 | 2014 | 493 | -1 | 1 | -493 |
| 5 | 2015 | 495 | 0 | 0 | 0 |
| 6 | 2016 | 640 | 1 | 1 | 640 |
| 7 | 2017 | 670 | 2 | 4 | 1340 |
| 8 | 2018 | 732 | 3 | 9 | 2196 |
| 9 | 2019 | 778 | 4 | 16 | 3112 |
| 10 | 2020 | 837 | 5 | 25 | 4185 |
| Total | 7362 | 85 | 2493 |
Table 2: Time series analysis of Indian Contribution in Physics in Web of Science
To arrive at assessments for future growth, Straight line equation is applied under the Time series analysis.
Straight line equation is Yc=a+bx, since Σx=0
a= ΣY/N=2493/10=249.3b= ΣXY/ Σx2=2493/85=29.32941
Estimated literature in 2030 is, when X=2030-2014=16
Y=a+bX
Y=249.3+29.32941*16=718.5706
Y=718.57
From the above results, it is found that there is an increasing trend of research literature in the future years. Therefore, the corollary of the study is Indian contribution in physics of web of science research literature is growing in India.
Ranking of journals
Analysis of data indicates disparity in the perception of the three dimensions of quality assurance the ranking of journals is essentially a practical tool designed to help the librarian and research scientist to select the journals of maximum utility in relation to their coverage of new and important literature in particular subject area. A total number of 7362 citations of Indian Physicist in Web of Science, All citations are journal citations. The journal ranking is shown in the Table 3.
| S. no. | Journal Title | No of journal | % | Rank |
|---|---|---|---|---|
| 1 | Journal of applied physics | 657 | 8.93 | 1 |
| 2 | Journal of high energy physics | 510 | 6.93 | 2 |
| 3 | Applied physics letters | 323 | 4.39 | 3 |
| 4 | Physical review D | 301 | 4.09 | 4 |
| 5 | Physics of plasmas | 261 | 3.55 | 5 |
| 6 | Physics letters B | 245 | 3.33 | 6 |
| 7 | Journal of chemical physics | 219 | 2.98 | 7 |
| 8 | Monthly notices of the royal astronomical society | 145 | 1.97 | 8 |
| 9 | Physical review B | 114 | 1.55 | 9 |
| 10 | Review of scientific instruments | 110 | 1.49 | 10 |
| 11 | Journal of cosmology and astroparticle physics | 109 | 1.48 | 11 |
| 12 | European physical journal C | 107 | 1.45 | 12 |
| 13 | Journal of instrumentation | 90 | 1.22 | 13 |
| 14 | Japanese journal of applied physics | 89 | 1.21 | 14 |
| 15 | Astrophysical journal | 83 | 1.13 | 15 |
| 16 | Pramana-journal of physics | 81 | 1.10 | 16 |
| 17 | Physics of fluids | 78 | 1.06 | 17 |
| 18 | Ieee transactions on electron devices | 75 | 1.02 | 18 |
| 19 | Physical review letters | 71 | 0.96 | 19 |
| 20 | Journal of renewable and sustainable energy | 70 | 0.95 | 20 |
| Conti…. | ||||
| Total | 7362 | 100.03 | 100 |
Table 3: Ranking of journal
The Table 3 shows the rank list of journals that have been cited by the researchers in Indian physicist. These citations have been arranged in descending order of the numbers of journal citations. There are total 7362 journals which are cited by the researchers in web of science during the period of the study. The study shows that, the journal of “Journal of Applied Physics” score the first rank which account to 657 (8.93%) of the total papers. The “journal of high energy physics” scored second rank with 510 (i.e. 6.93%) papers and “applied physics letters” 323 (i.e. 4.39%) scored third rank in the rank list. “physical review D” comes to next in citation by the researchers with 301 (4.09%) citations, followed by “physics of plasmas” with 261 (3.55%) citations respectively.
Bradford’s law of scattering
In 1934 Samuel Clement Bradford has formulated the law of scattering to describe the distribution of articles on a particular subject in different periodicals. His article, “sources of information on specific subject” was the first publication on observation on scattering. He explained his empirical law as: “If scientific journals are arranged in order of decreasing productivity of articles on a given subject, they may be divided into a nucleus of three equal zones and succeeding zones will be 1:n:n2.” In the present set of data of all proceedings, number of authors have been arranged in order of decreasing productivity of articles. They were divided into a nucleus of 3 equal zones, number of papers in each zone were more or less equal, while the number of authors in each zone were increasing rapidly, which is shown in Table 4.
| Zone | No. of papers | No of authors |
|---|---|---|
| I | 2454 | 7 |
| II | 2454 | 55 |
| III | 2454 | 957 |
| 7362 | 1019 |
Table 4: Bradford’s Law of scattering.
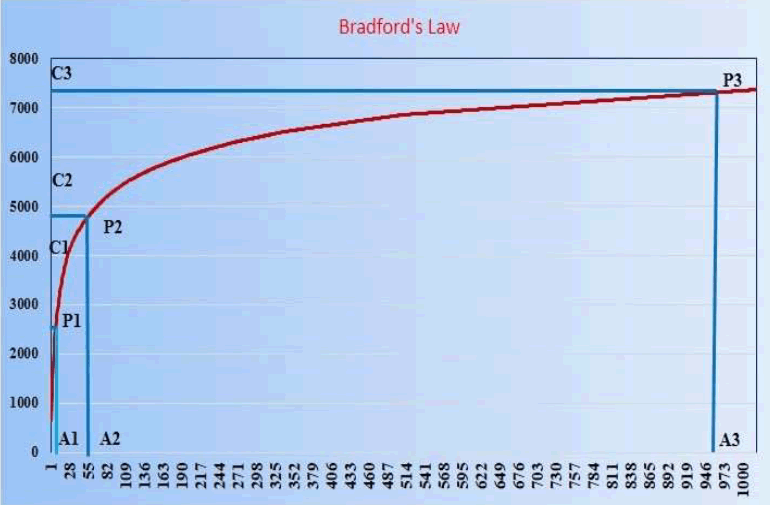
It can be seen from Table 4 that the total numbers of 7362 publications of overall journals were divided into 3 equal zones, while numbers of authors writing similar number of papers in each zone were in the ratio of 7:55:957. This indicates that the data verbally fits into the Bradford’s law of scattering (Figure 3).
Figure 3: Bradford’ curve for overall proceedings
The Figure 3 clearly indicates that, the data set of overall proceedings graphically fits into the Bradford’s law of scattering.
The Bradford’s algebraic interpretation of the law is 1:n:n2. The connection of each zone in this study is 7:55:957. Here 7 is the number of journals in the nucleus zone and mean Bradford’s multiplier is the 12.63.
Hence,
7: 7 × (12.63): 7 × (12.63)2 :: 1: n: n2
7: 88.41: 1116.62 > 1212.03
Percentage of Error =1212.03-1019/1019 × 100
% error=193.03/1019 × 100
% error=0.1894 × 100=18.94%
Here the percentage of error is negligible. It is also observed that, the number of journals contributing citations to each zone increases by a multiplier of 12.63. So it can be said that the distribution in present study follow Bradford’s law, for more confirmation of this law we can apply one more law i.e. Leimkuhler model.
Application of Leimkuhler model
In the present study Bradford,s law as well as Leimkuhler models both are tested to verity the scattering of literature in Economics. Leimkuhler has developed a model based on Bradford’s verbal formulation as shown below (Table 5):
For application of Bradford’s law, the citation distribution was divided in three equal zones (p). Bradford’s assumes that there should be minimum three equal zones, here also ‘p’ is to be 3. Than by using the mathematical formula for calculating the Bradford’s multiplier ‘k’ as.
k=(eyXym)1/p
Where, y is Euler’s number having value 0.57772 e=2.718 (constant)=ey=2.7180.57772= 1.781(ey=1.781)
Where ey=1.781
P is Bradford number of zones=3
Ym is the number of citation of rank first journal=657
If the sources are ranked in decreasing order of productivity, then ym is the number of items in the most productivity sources.
ro=number of journals in Bradford’s first zone
T=Total number of journals in Bradford zone
k=(ey*Ym)1/p=(1.781*657)1/3=(1170.117)1/3
k=10.54
yo=A/P
Where yo=No. of citation/articles in each zone.
A=No. of citation/articles
yo=A/P=7362/3
yo=2454
The nucleus zone ro can be defined as:
ro=T (k-1)/(kp-1)
= 1019(10.54-1)/(10.54)3-1
= 1019*9.54/(10.54*10.54*10.54)-1
= 9721.26/(1170.9054-1)
= 9721.26/1169.9054
ro=8.3094
Different Bradford’s zone can be obtained using the value of ‘k’ and ‘ro’.
Nucleus zone=ro=rox1=8.3094 × 1=8.3094
First zone=r1 = roxk = 8.3094 × 10.54=87.581
Second zone=r2=roxk2= 8.3094 × (10.54)2=923.1045
a = Y0/log K = 2454/log 10.54= 2454/1.02284
=2510.051
b = k-1/ro=10.54-1/8.3094
= 9.54/8.3094
= 1.1480
| Zone | No. of papers | No of authors |
|---|---|---|
| I | 2661 | 8 |
| II | 2604 | 88 |
| III | 2097 | 923 |
| 7362 | 1019 |
Table 5: Bradford’s distribution of cited journals as per Leimkuhler model
The findings are shown in Table 5 the number of journals in the nucleus is found to be 8.3094 and From Table 5, Bradford multiplier10.74
Therefore expression can be given as:
8.3 : 8.3 × (10.74) : 8.3 × (10.74)2:: 1:n:n2
8.3 : 89.142:957.3851>1054.827
Percentage of error=(1054.827-1019)/1019 * 100
Percentage of error=3.5158%
Hence, it can be noted from the above calculations that, the nucleus zone is having 8 (8.3094) the first zone is having 88 (87.581) and the last zone is having 923(923.1045). i.e., from the above table we can find it is 8, 88 and 923 respectively. Bradford’s law of scattering in the area of Indian Physicist in Web of Science. It is clear that percentage of error is not so high and hence the Data will fit Bradford's Lawin the present data set for Bradford multiplier=10.74.
Conclusion
In the present study comprehensive scientrometric techniques were applied and presented in the form of different tables to evaluate the research trends in Indian physicists research. It was found that articles on Indian physicists during 2011-2020 deals with different research areas. A total of 7362 articles were published in journals. As per the ranked list of journals, the journal of applied physics is the most productive journals. The study also reveals that the distribution of literature on Indian Physicists follows the Bradford Law of scattering. The present study shall be helpful in identifying the core journals in the area of Indian physicists research.
References
- Chiu, W. T. and Ho, Y. S. ‘’Bibliometric analysis oftsunami research.’’ Scientometrics. 73. 1 (2007): 3-17.
- Garfield, E. ‘’From the Science of Science to Scientometrics: Visualizing the history of science with HistCite software.’’ J Informetr. 3.3 (2007): 173-9.
- Glossary of Thompson scientific terminology. The Thompson Corporation. (2008).
- Hood, W.W. and Wilson, C. ‘’The literature of bibliometrics, scientometrics, and informetrics.’’ Scientometrics. 52.2 (2001): 291–314.
- Kumar, A. and Mohindra, R.’’Bibliometric analysis on knowledge management research.’’ Int J Infor Diss Tech. 5.2 (2015): 106-113.
- Liu, L., Jiao, J. H. and Chen, L. Bibliometric study ofdiabetic retinopathy during 2000–2010 by ISI. Int J Ophthalmol. 4.4 (2011): 333.
[Crossref] [Google Scholar] [PubMed]
- Manikandan, M and N. Amsaveni. Management Information System Research Output: A Scientometric Study. Int J Lib Inf Sci. 5.1 (2016):2277-3533.
- Gajbe, S. S., and Sonawane, S. S.’’Mapping of Leprosy Literature: A Bibliometric Study.’’ Int J Lib Inf Sci. 3.2 (2016)
- Gajbe, S.S., and Sonawane, S.S. ‘’Authorship Pattern and Degree of Collaboration in Theleprosy Research: A Scientometrics Study.’’ Int J Lib Inf Sci. 2. 6 (2015).
Author Info
Gajbe Sankalp S1* and Sonwane Shashank22Department of Library and Information Science, Dr. Babasaheb Ambedkar Marathwada University Aurangabad, Maharashtra State, India
Received: 05-Aug-2023, Manuscript No. IJLIS-23-109370; Editor assigned: 08-Aug-2023, Pre QC No. IJLIS-23-109370 (PQ); Reviewed: 23-Aug-2023, QC No. IJLIS-23-109370; Revised: 19-Jan-2025, Manuscript No. IJLIS-23-109370 (R); Published: 26-Jan-2025, DOI: 10.35248/2231-4911.25.15.858
Copyright: This is an open access article distributed under the terms of the Creative Commons Attribution License, which permits unrestricted use, distribution, and reproduction in any medium, provided the original work is properly cited.
Call for Papers
Authors can contribute papers on
What is Your ORCID
Register for the persistent digital identifier that distinguishes you from every other researcher.
Social Bookmarking
Know Your Citation Style
American Psychological Association (APA)
Modern Language Association (MLA)
American Anthropological Association (AAA)
Society for American Archaeology
American Antiquity Citation Style
American Medical Association (AMA)
American Political Science Association(APSA)


