Research Article - (2023) Volume 13, Issue 1
Global Research Output in the Patent Publication: A Scientometric Study
Bhagat Meenakshi Pandurang* and Vaishali KhapardeAbstract
The present study analyzed research output for a period of ten years between 2011 to and 2020. Web of science database a service from clarivate analytics has been used to download citation and source data. Histcite application software have been used to present the datasets. The study focuses on author productivity pattern, types of documents, individual author’s research productivity and their TLCS (Total Local Citation Score), TGCS (Total Global Citation Score) TLCR (Total Local Citation References) in addition to this scientographical mapping of data is presented through graphs using VOS viewer software mapping technique.
Keywords
Scientometric analysis, VOS viewer, Patent, TLCS (Total Local Citation Score).
Introduction
A patent is a type of intellectual property that gives its owner the legal right to exclude others from making, using, or selling an invention for a limited period of years in exchange for publishing an enabling disclosure of the invention. In most countries, patent rights fall under private law and the patent holder must sue someone infringing the patent in order to enforce their rights [1]. In some industries patents are an essential form of competitive advantage; in others they are irrelevant.
Under the World Trade Organization's (WTO) TRIPS agreement, patents should be available in WTO member states for any invention, in all fields of technology, provided they are new, involve an inventive step, and are capable of industrial application [2]. The procedure for granting patents, requirements placed on the patentee, and the extent of the exclusive rights vary widely between countries according to national laws and international agreements. Typically, however, a patent application must include one or more claims that define the scope of protection that is being sought. A patent may include many claims, each of which defines a specific property right.
The paper analyses research output of organic farming discipline of ‘J-gate plus’ databases during 1980-2018. The analysis indicates that highest number of journals and international collaboration, subject wise, top authorship pattern, year wise relative growth rate and doubling time of records in year wise and top most productive journals [3]. The major research is focused organic farming, agriculture plants. A total number of 6886 records for 38 years between 1980 to 2018 were retrieved from ‘J-gate plus ’databases. The study explores the quantitative analysis of research performance of the Organic Farming research output in world level. The study aims to ascertain the growth of literature, top authors, relative growth rate, source wise publications identification of prolific authors, country wise and core journals of organic farming.
Santosh D, Vaishali KS, Sagar AP. Mapping of world publications: Sydenham chorea disease. The paper focuses on mapping of world publications: Sydenham chorea disease. Which has given on PubMed database for during the year 2000 to 2018? There are total 9799 documents on Sydenham chorea disease. It discusses on ascertain the Sydenham chorea research of documents, ranking of most prolific authors, institution wise distribution of publications. The main objective of the study is to analyze to ascertain the Sydenham chorea research output in world during 2000 to 2018. The present study analyzed research output for a period of 5 years between 2015 to and 2019 [4]. Web of Science database a service from clarivate analytics has been used to download citation and source data. Histcite application software have been used to present the datasets. Analysis part focuses on the parameters like citation impact at local and global level, influential authors and their total output, ranking of contributing institutions and countries.
Materials and Methods
Objectives of the study
•To identify year wise distribution of publications.
•To identify document wise contribution of publication.
•To analyse the authorship pattern and examine the extent of research collaboration.
•To identify journal wise distribution of publications.
•To find out the most common key word used while publication.
•To identify language wise distribution of publications.
•To assess the institution wise research concentration and global citation score of thePublications.
•To identify country wise distribution of publications.
•To identify Institution with subdivision wise of contribution.
The research publications were retrieved from the web of science core collections database on the topic patent publication which is scattered over the period from 2011 to 2020 [5]. The search was carried out using the keyword “patent publication” in the topic field. A total of 1030 publications were downloaded and the same was analysed using the software Histcite, VOS viewer and Microsoft Excel as per the objectives of the study.
Results and Discussion
Data analysis and interpretation
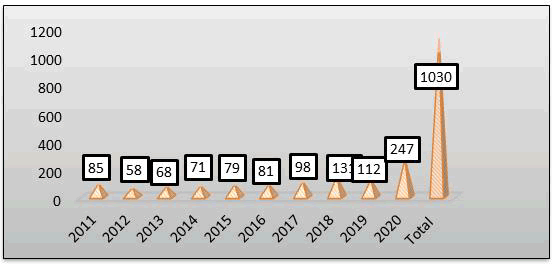
The Table 1 and Figure 1 reveals that the numbers of research documents published from 2011 to 2020 are gradually increased. According to the publication output from the Table 1. The year wise distribution of research documents, 2020 has the highest number of research documents 247 (23.98%) with 2 of total local citation score and 637 total global citation score. The year 2019 has 112 (10.87%) research documents and it stood in second position with 7of total local citation score and 1092 total global citation score. It is noticed that the increase in publications may not create impact on citation score yet the quality matters on total local citation scores and on total global citation scores [6].
| Sr. No. | Publication year | Records | Percent | TLCS | TGCS |
|---|---|---|---|---|---|
| 1 | 2011 | 85 | 8.25 | 6 | 4306 |
| 2 | 2012 | 58 | 5.63 | 8 | 2504 |
| 3 | 2013 | 68 | 6.6 | 17 | 3767 |
| 4 | 2014 | 71 | 6.89 | 15 | 2126 |
| 5 | 2015 | 79 | 7.67 | 10 | 2205 |
| 6 | 2016 | 81 | 7.86 | 24 | 1482 |
| 7 | 2017 | 98 | 9.51 | 18 | 3174 |
| 8 | 2018 | 131 | 12.72 | 12 | 1434 |
| 9 | 2019 | 112 | 10.87 | 7 | 1092 |
| 10 | 2020 | 247 | 23.98 | 2 | 637 |
| / | Total | 1030 | 100 | / | / |
Table 1: Annual distribution of publications and citations
Figure 1: Year wise distribution of publications
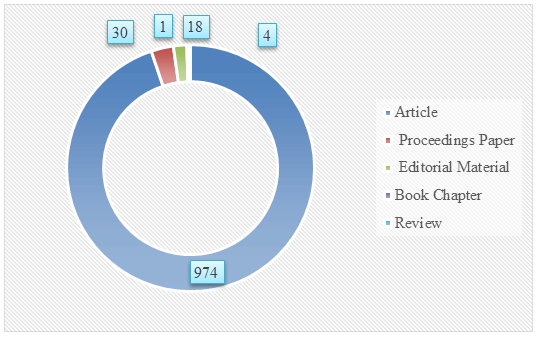
Document type indicates the type of publication in which the researchers published their research outputs. Most of them published in a form of articles. Table 2 and Figure 2 reveal the distribution of the research output according to document type [7]. It is an accepted fact that most of the scholarly communication of scientific research is published in journals as articles and sometimes presented in book chapter and proceedings papers. Article 974 (94.8%) with TLCS (Total Local Citation Score) is 264 and TGCS (Total Global Citation Score) is 41624. Proceeding paper 30 (2.9%) with TLCS is 3 and TGCS is 1393 respectively.
| Sr.No. | Document type | Records | Percent | TLCS | TGCS |
|---|---|---|---|---|---|
| 1 | Article | 974 | 94.8 | 264 | 41624 |
| 2 | Proceedings paper | 30 | 2.9 | 3 | 1393 |
| 3 | Editorial material | 18 | 1.8 | 0 | 4 |
| 4 | Book chapter | 4 | 0.4 | 2 | 60 |
| 5 | Review | 1 | 0.1 | 0 | 1 |
Table 2: Document wise contribution of publication
Figure 2: Document wise distribution of publication
Analysis of the top 30 most productive author
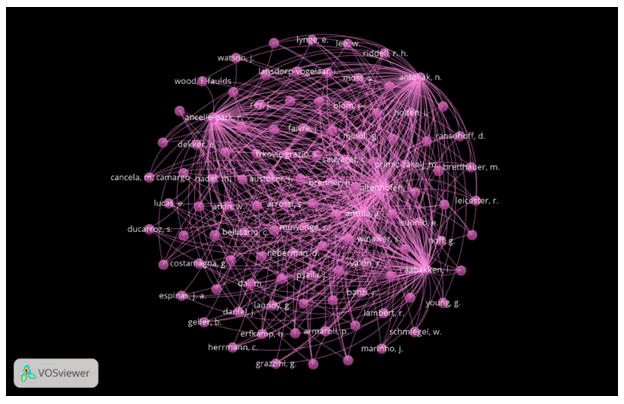
Table 3 and Figure 3 Showed the ranking of authors of research articles in the rank analysis the authors who have published more than 5 articles or more are considered into account to avoid a long list. It was observed that there is total of 1030 author’s records and it shows the top 30 most productive authors during 2011-2020 [8]. It shows the author’s TLCS (Total Local Citation Score, which is the number of times cited by other papers in the local collection) TLCS/t (average value of TLCS in a year) TGCS (Total Global Citation Score, which is the citation frequency based on the full Web of Sciences count at the time the data was downloaded) TGCS/t (Average value of TGCS in a year) TLCR (Total Local Citation References).
Zhou Y is topmost author with published research records of 8 (0.8%), with 7 in TLCS, 228 in TGCS, 14 in TLCR and TLCS/t 2.25 with 98 TGCS/t contributions to all-over research contribution. Following research Authors are Grimpe C, Hussinger K and Link A.N .respectively. The data set clearly depicts that no matter how many publications that an author brings out yet the quality publications alone shows impact in the form of total local citations score and total global citations score.
| Sr. No. | Author | Records | Percent | TLCS | TLCS/t | TLCSx | TGCS | TGCS/t | TLCR |
|---|---|---|---|---|---|---|---|---|---|
| 1 | Zhou Y | 8 | 0.8 | 7 | 2.25 | 1 | 228 | 98 | 14 |
| 2 | Grimpe C | 6 | 0.6 | 3 | 0.33 | 1 | 223 | 22.71 | 8 |
| 3 | Hussinger K | 5 | 0.5 | 3 | 0.33 | 1 | 137 | 16.12 | 6 |
| 4 | Link AN | 5 | 0.5 | 1 | 0.07 | 1 | 102 | 9 | 0 |
| 5 | Wu Y | 5 | 0.5 | 4 | 0.36 | 0 | 199 | 23.97 | 4 |
| 6 | Colombelli A | 4 | 0.4 | 2 | 0.22 | 1 | 110 | 17.9 | 9 |
| 7 | Corradini C | 4 | 0.4 | 4 | 0.64 | 0 | 34 | 6.86 | 13 |
| 8 | de Faria P | 4 | 0.4 | 3 | 0.54 | 2 | 33 | 6.99 | 5 |
| 9 | Gronseth GS | 4 | 0.4 | 0 | 0 | 0 | 404 | 36.41 | 0 |
| 10 | Hu YY | 4 | 0.4 | 4 | 0.36 | 0 | 153 | 16.31 | 4 |
| 11 | Li Y | 4 | 0.4 | 0 | 0 | 0 | 43 | 8.49 | 2 |
| 12 | Liu J | 4 | 0.4 | 1 | 0.14 | 0 | 64 | 9.98 | 0 |
| 13 | Luo SL | 4 | 0.4 | 4 | 0.36 | 0 | 153 | 16.31 | 4 |
| 14 | McIntosh JM | 4 | 0.4 | 4 | 0.36 | 0 | 153 | 16.31 | 4 |
| 15 | Quatraro F | 4 | 0.4 | 2 | 0.22 | 1 | 110 | 17.9 | 9 |
| 16 | Zhangsun DT | 4 | 0.4 | 4 | 0.36 | 0 | 153 | 16.31 | 4 |
| 17 | Zhu XP | 4 | 0.4 | 4 | 0.36 | 0 | 153 | 16.31 | 4 |
| 18 | Aldieri L | 3 | 0.3 | 1 | 0.25 | 0 | 64 | 16 | 3 |
| 19 | Beyeler N | 3 | 0.3 | 1 | 0.14 | 0 | 58 | 8.4 | 1 |
| 20 | Bolton EE | 3 | 0.3 | 0 | 0 | 0 | 96 | 91.51 | 1 |
| 21 | Chen YJ | 3 | 0.3 | 0 | 0 | 0 | 97 | 7.71 | 0 |
| 22 | Chen Z | 3 | 0.3 | 0 | 0 | 0 | 12 | 3.21 | 2 |
| 23 | Christensen S | 3 | 0.3 | 4 | 0.36 | 0 | 113 | 11.31 | 2 |
| 24 | Craik DJ | 3 | 0.3 | 4 | 0.36 | 0 | 125 | 13.19 | 3 |
| 25 | Czarnitzki D | 3 | 0.3 | 4 | 0.58 | 3 | 114 | 12.63 | 1 |
| 26 | Demirel P | 3 | 0.3 | 3 | 0.5 | 0 | 93 | 10.63 | 3 |
| 27 | Drivas K | 3 | 0.3 | 0 | 0 | 0 | 19 | 3.5 | 2 |
| 28 | Duysters G | 3 | 0.3 | 8 | 0.67 | 7 | 272 | 20.58 | 3 |
| 29 | Greisen G | 3 | 0.3 | 1 | 0.2 | 0 | 567 | 140.47 | 1 |
|
30 |
Hagedoorn J |
3 |
0.3 |
0 |
0 |
0 |
122 |
8 |
5 |
Table 3: Publication output of top 30 authors and citation score
Figure 3: Author wise distribution of publications (five cluster)
Analysis of the top 30 journal wise distribution of publications
The study found that the total research output of the patent publication for the study period (2011–2020) published in 1030 journals. Table 4 shows the journal “research policy” topped with 31 (3%) publications with the total local citation score of 34 and total global citation score 3005. Second position “Plos One” with 24 (.3%) publications with the no total local citation score and total global citation score 471 [9]. Third position by “sustainability” with 19 (1.9%) publications with the total global citation score of 133 respectively.
| Sr. N. | Journal | Records | % | TLCS | TLCS/t | TGCS | TGCS/t | TLCR |
|---|---|---|---|---|---|---|---|---|
| 1 | Research policy | 31 | 3 | 34 | 3.81 | 3005 | 265.3 | 25 |
| 2 | Plos one | 24 | 2.3 | 0 | 0 | 471 | 61.99 | 8 |
| 3 | Sustainability | 19 | 1.9 | 0 | 0 | 133 | 43.13 | 11 |
| 4 | Technological forecasting and social change | 18 | 1.8 | 9 | 1.82 | 375 | 76.18 | 16 |
| 5 | Journal of vascular surgery | 16 | 1.6 | 1 | 0.04 | 691 | 43.06 | 1 |
| 6 | Journal of technology transfer | 15 | 1.5 | 7 | 0.82 | 357 | 40.27 | 4 |
| 7 | Scientometrics | 14 | 1.4 | 7 | 1.26 | 343 | 46.7 | 8 |
| 8 | Clinical orthopaedics and related research | 13 | 1.3 | 0 | 0 | 719 | 72.66 | 0 |
| 9 | Journal of cheminformatics | 13 | 1.3 | 0 | 0 | 300 | 36.52 | 2 |
| 10 | Nucleic acids research | 13 | 1.3 | 12 | 1.8 | 2121 | 385.13 | 6 |
| 11 | Neurology | 10 | 1 | 3 | 0.28 | 995 | 91.92 | 1 |
| 12 | Small business economics | 9 | 0.9 | 2 | 0.5 | 337 | 36.35 | 15 |
| 13 | Industrial and corporate change | 8 | 0.8 | 2 | 0.33 | 190 | 24.55 | 8 |
| 14 | IEEE access | 7 | 0.7 | 0 | 0 | 19 | 11.33 | 0 |
| 15 | Management science | 7 | 0.7 | 6 | 0.72 | 464 | 42.38 | 8 |
| 16 | Strategic management journal | 7 | 0.7 | 9 | 0.61 | 1813 | 85.26 | 6 |
| 17 | Annals of regional science | 6 | 0.6 | 0 | 0 | 366 | 28.82 | 3 |
| 18 | BMC health services research | 6 | 0.6 | 0 | 0 | 71 | 10.33 | 1 |
| 19 | Energy policy | 6 | 0.6 | 2 | 0.29 | 346 | 55.59 | 3 |
| 20 | Human reproduction | 6 | 0.6 | 1 | 0.05 | 129 | 16.32 | 1 |
| 21 | Industry and innovation | 6 | 0.6 | 0 | 0 | 163 | 22.63 | 11 |
| 22 | Organization science | 6 | 0.6 | 5 | 0.53 | 155 | 18.42 | 3 |
| 23 | Applied economics | 5 | 0.5 | 1 | 0.08 | 46 | 4.75 | 4 |
| 24 | Economics of innovation and new technology | 5 | 0.5 | 8 | 1.37 | 89 | 14.87 | 1 |
| 25 | Engineering economics | 5 | 0.5 | 0 | 0 | 26 | 4.23 | 2 |
| 26 | Journal of biological chemistry | 5 | 0.5 | 4 | 0.36 | 198 | 18.13 | 1 |
| 27 | Medicine | 5 | 0.5 | 0 | 0 | 4 | 1.08 | 0 |
| 28 | Neurosurgical focus | 5 | 0.5 | 0 | 0 | 116 | 12.7 | 1 |
| 29 | Regional studies | 5 | 0.5 | 2 | 0.11 | 808 | 53.68 | 3 |
| 30 | Stroke | 5 | 0.5 | 1 | 0.09 | 1323 | 121.91 | 1 |
Table 4: Journal wise distribution of the publication output of top 30
Analysis of the top 30 most productive keywords
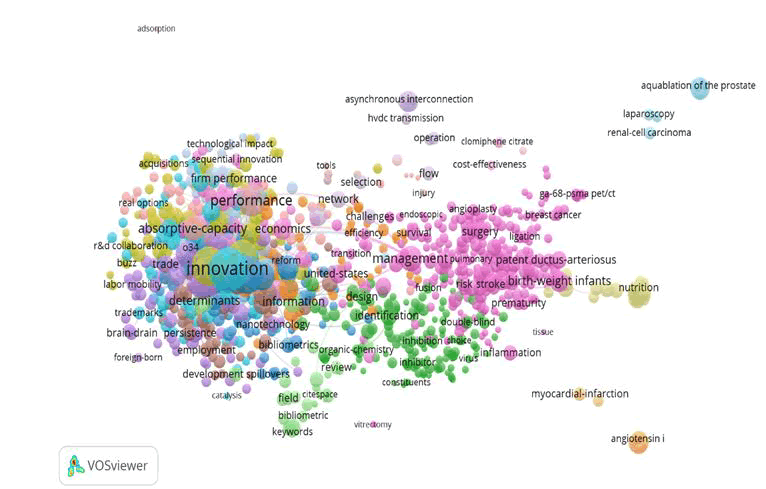
Table 5 and Figure 4 present the top 30 keywords used by the researchers in their publications. It is clearly seen from the table that the word “patent” has been used 118 (11.5%) times by the researchers with total local citation score 105 and total local citation score is 5243. Fallowed by” innovation” has been used 101 (9.8%) times by the researchers with total local citation score 22 and total local citation score is 2639 [10]. “Analysis” with used 99 (9.6%) times by the researchers with total local citation score 18 and total local citation score is 3045 respectively.
| Sr.No. | Keyword | Records | Percent | TLCS | TGCS |
|---|---|---|---|---|---|
| 1 | Patent | 118 | 11.5 | 105 | 5243 |
| 2 | Innovation | 101 | 9.8 | 22 | 2639 |
| 3 | Analysis | 99 | 9.6 | 18 | 3045 |
| 4 | Technology | 60 | 5.8 | 29 | 2247 |
| 5 | Evidence | 54 | 5.3 | 11 | 1888 |
| 6 | Case | 53 | 5.2 | 11 | 827 |
| 7 | Knowledge | 53 | 5.2 | 23 | 3351 |
| 8 | Patents | 52 | 5.1 | 21 | 960 |
| 9 | Research | 51 | 5 | 7 | 2382 |
| 10 | Based | 47 | 4.6 | 7 | 1660 |
| 11 | Development | 41 | 4 | 3 | 1135 |
| 12 | Review | 41 | 4 | 4 | 2064 |
| 13 | Technological | 41 | 4 | 22 | 1196 |
| 14 | Treatment | 40 | 3.9 | 0 | 1226 |
| 15 | Literature | 35 | 3.4 | 7 | 554 |
| 16 | Report | 33 | 3.2 | 4 | 1189 |
| 17 | Using | 33 | 3.2 | 10 | 718 |
| 18 | Disease | 31 | 3 | 0 | 1205 |
| 19 | New | 31 | 3 | 6 | 870 |
| 20 | Performance | 30 | 2.9 | 6 | 724 |
| 21 | Industry | 29 | 2.8 | 11 | 1021 |
| 22 | Firms | 28 | 2.7 | 13 | 833 |
| 23 | Clinical | 27 | 2.6 | 0 | 974 |
| 24 | Meta | 27 | 2.6 | 3 | 1010 |
| 25 | Network | 27 | 2.6 | 6 | 698 |
| 26 | China | 26 | 2.5 | 5 | 208 |
| 27 | Effects | 26 | 2.5 | 2 | 458 |
| 28 | Model | 26 | 2.5 | 19 | 3511 |
| 29 | Patients | 24 | 2.3 | 0 | 636 |
| 30 | Effect | 23 | 2.2 | 1 | 369 |
Table 5: Keyword wise contribution of publication
Figure 4: Keywords density visualization
Analysis of the publication output of top 20 countries
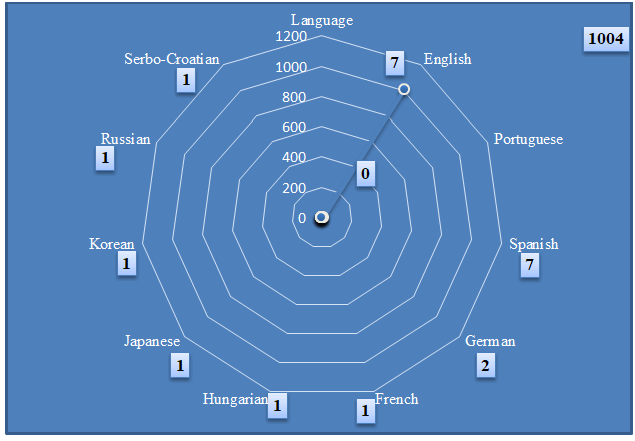
Table 6 and Figure 5 displays the publication output of the language of papers and english 1004 (97.4%) with 269 total local citation score and total global citation score is 43030. Portuguese 7 (0.7%) with no total local citation score and total global citation score is 23 respectively.
| Sr. No. | Language | Records | Percent | TLCS | TGCS |
|---|---|---|---|---|---|
| 1 | English | 1004 | 97.8 | 269 | 43030 |
| 2 | Portuguese | 7 | 0.7 | 0 | 23 |
| 3 | Spanish | 7 | 0.7 | 0 | 10 |
| 4 | German | 2 | 0.2 | 0 | 4 |
| 5 | French | 1 | 0.1 | 0 | 2 |
| 6 | Hungarian | 1 | 0.1 | 0 | 1 |
| 7 | Japanese | 1 | 0.1 | 0 | 5 |
| 8 | Korean | 1 | 0.1 | 0 | 4 |
| 9 | Russian | 1 | 0.1 | 0 | 0 |
| 10 | Serbo-Croatian | 1 | 0.1 | 0 | 3 |
| 11 | Slovenian | 1 | 0.1 | 0 | 0 |
Table 6: Language wise distribution of contribution
Figure 5: Language wise distribution of contribution
Analysis of the publication output of top 30 institutions
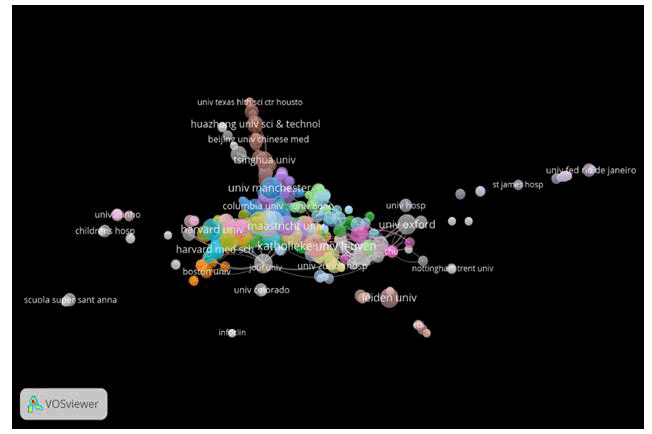
The individualities of 30 most productive institutions were analyzed in this part, institutions which published more than 25 and above publications have considered as highly productive institutions [11]. Table 7 summarizes articles, the total local citation score, and local global citation score and average author per paper of the publications of these institutions. The institution “Katholieke Univ Leuven” holds the first rank and the Institution published 22 (2.1%) research papers with 12 local and 1133 global citation Scores, the second rank holds by “Harvard Univ” the institution published 20 (1.9%) research papers with 1 local and 865 global citation scores. The “Stanford Univ” holds the 3rd rank, the institution published 17 (1.7%)research papers with 11 local and 1256 global citation scores [12]. The “Univ Manchester” holds the 4th rank; the institution published 17 (1.7%) research papers with no local and 272 globalcitation scores. The “Duke Univ” holds the 5th rank; the institution published 15 (1.5%) researchpapers with 1 local and 1249 global citation scores. It is clear from the analysis that following institutions Maastricht Univ, Univ Toronto Univ Utrecht, identified the most productive Institutions based on the number of research papers published.
| Sr.No. | Institution | Records | Percent | TLCS | TGCS |
|---|---|---|---|---|---|
| 1 | Katholieke Univ Leuven | 22 | 2.1 | 12 | 1133 |
| 2 | Harvard Univ | 20 | 1.9 | 1 | 865 |
| 3 | Stanford Univ | 17 | 1.7 | 11 | 1256 |
| 4 | Univ Manchester | 17 | 1.7 | 0 | 272 |
| 5 | Duke Univ | 15 | 1.5 | 1 | 1249 |
| 6 | Maastricht Univ | 14 | 1.4 | 14 | 490 |
| 7 | Univ Toronto | 14 | 1.4 | 12 | 2571 |
| 8 | Univ Utrecht | 14 | 1.4 | 2 | 668 |
| 9 | Univ Oxford | 13 | 1.3 | 5 | 851 |
| 10 | Leiden Univ | 12 | 1.2 | 1 | 514 |
| 11 | Mayo Clin | 12 | 1.2 | 0 | 842 |
| 12 | MIT | 12 | 1.2 | 6 | 462 |
| 13 | NYU | 12 | 1.2 | 5 | 604 |
| 14 | Univ Groningen | 12 | 1.2 | 8 | 316 |
| 15 | Natl Bur Econ Res | 11 | 1.1 | 10 | 691 |
| 16 | Univ Calif Los Angeles | 11 | 1.1 | 5 | 1511 |
| 17 | Univ Calif San Francisco | 11 | 1.1 | 2 | 462 |
| 18 | Univ Michigan | 11 | 1.1 | 11 | 2252 |
| 19 | Emory Univ | 10 | 1 | 0 | 373 |
| 20 | Univ Calif Berkeley | 10 | 1 | 4 | 173 |
| 21 | Univ Chicago | 10 | 1 | 1 | 811 |
| 22 | Univ Washington | 10 | 1 | 0 | 395 |
| 23 | Harvard Med Sch | 9 | 0.9 | 0 | 296 |
| 24 | Huazhong Univ Sci and Technol | 9 | 0.9 | 0 | 83 |
| 25 | Tsinghua Univ | 9 | 0.9 | 7 | 228 |
| 26 | Univ Cambridge | 9 | 0.9 | 5 | 1354 |
| 27 | Univ Edinburgh | 9 | 0.9 | 0 | 1383 |
| 28 | Univ Milan | 9 | 0.9 | 3 | 466 |
| 29 | Univ N Carolina | 9 | 0.9 | 1 | 554 |
| 30 | Univ Penn | 9 | 0.9 | 3 | 713 |
Table 7: Institution wise distribution of contribution
Figure 6: Collaboration of institutions and their clusters
Analysis of the publication output of top 30 countries
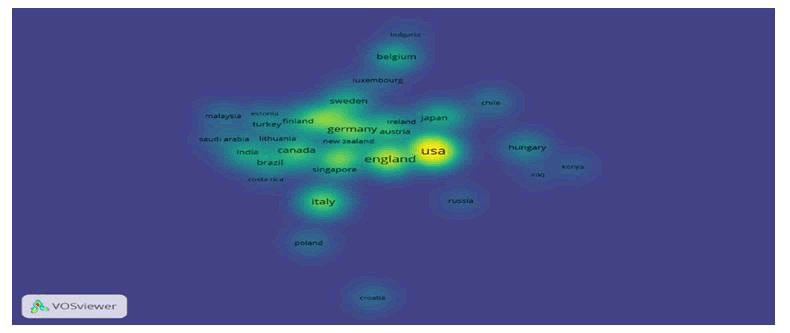
Table 8 and Figure 7 displays the publication output of the top twenty countries by number of papers and USA 365 (35.2%) acquired 1st rank among the top twenty countries underconsideration with its total global citation score 20667. In all 114 countries participated in research during 2011-2020. The countries that rank between 2nd and 25th position are UK,Peoples R China, Italy, Germany, Netherlands, Spain, Canada, and France. We have found by using this country mapping analysis that there are nodes with clarity of linking between each node, which indicates that there are countries linking and associated with other associated countries. It could be identified that the country wise analysis the following countries USA, UK, peoples R China, and Italy identified the most productive country based on the number of research papers published [13].
| Sr. No. | Country | Records | Percent | TLCS | TGCS |
|---|---|---|---|---|---|
| 1 | USA | 362 | 35.2 | 140 | 20667 |
| 2 | UK | 194 | 18.9 | 60 | 9861 |
| 3 | Peoples R China | 105 | 10.2 | 12 | 2027 |
| 4 | Italy | 102 | 9.9 | 16 | 4712 |
| 5 | Germany | 93 | 9.1 | 18 | 4095 |
| 6 | Netherlands | 89 | 8.7 | 29 | 3890 |
| 7 | Spain | 61 | 5.9 | 13 | 3006 |
| 8 | Canada | 57 | 5.6 | 31 | 9369 |
| 9 | France | 54 | 5.3 | 9 | 2265 |
| 10 | Belgium | 44 | 4.3 | 25 | 2353 |
| 11 | Switzerland | 42 | 4.1 | 4 | 3176 |
| 12 | Australia | 40 | 3.9 | 11 | 1626 |
| 13 | Brazil | 32 | 3.1 | 0 | 519 |
| 14 | Sweden | 31 | 3 | 3 | 2428 |
| 15 | Japan | 27 | 2.6 | 3 | 871 |
| 16 | Denmark | 22 | 2.1 | 8 | 1276 |
| 17 | India | 20 | 1.9 | 0 | 962 |
| 18 | Unknown | 18 | 1.8 | 2 | 1770 |
| 19 | Austria | 17 | 1.7 | 2 | 964 |
| 20 | Finland | 17 | 1.7 | 1 | 1375 |
| 21 | Turkey | 16 | 1.6 | 1 | 724 |
| 22 | South Korea | 15 | 1.5 | 2 | 1259 |
| 23 | Norway | 13 | 1.3 | 3 | 1399 |
| 24 | Taiwan | 12 | 1.2 | 0 | 472 |
| 25 | Hungary | 11 | 1.1 | 2 | 935 |
| 26 | Singapore | 11 | 1.1 | 4 | 430 |
| 27 | Ireland | 10 | 1 | 1 | 677 |
| 28 | Portugal | 10 | 1 | 0 | 463 |
| 29 | New Zealand | 9 | 0.9 | 5 | 1342 |
| 30 | Greece | 8 | 0.8 | 0 | 433 |
Table 8: Distribution of the publication output of top 30 countries
Figure 7: Showing Ranking of Country wise Distribution
Analysis of Top 30 institutions with subdivision wise of contribution
Table 9 shows including subdivisions published research papers during 2011-2020. The topmost twenty prolific institutions involved in this research have published 30 and more research articles. The institution “Natl Bur Econ Res” holds the first rank and the institution published 11 (1.1%) research papers with 10 local and 691 global citation scores, the second rank holds by “Harvard Univ, Sch Med” the institution published 10 (1%) research papers with 402 global citation scores. The “Emory Univ, Sch Med”holds the 3rd rank, the institution published 7 (0.7%)research papers with 3 local and 614 global citation scores respectively.
| Sr.No. | Institution with subdivision | Records | Percent | TLCS | TGCS |
|---|---|---|---|---|---|
| 1 | Natl Bur Econ Res | 11 | 1.1 | 10 | 691 |
| 2 | Harvard Univ, Sch Med | 10 | 1 | 0 | 402 |
| 3 | Emory Univ, Sch Med | 7 | 0.7 | 0 | 221 |
| 4 | Katholieke Univ Leuven | 7 | 0.7 | 3 | 614 |
| 5 | Tsinghua Univ, | 7 | 0.7 | 6 | 69 |
| 6 | CEPR | 6 | 0.6 | 8 | 432 |
| 7 | Duke Univ, Med Ctr | 6 | 0.6 | 0 | 752 |
| 8 | Katholieke Univ Leuven, | 6 | 0.6 | 4 | 170 |
| 9 | NBER | 6 | 0.6 | 11 | 551 |
| 10 | Johns Hopkins Univ, Sch Med | 5 | 0.5 | 0 | 501 |
| 11 | Stanford Univ, Sch Med | 5 | 0.5 | 0 | 563 |
| 12 | Univ Copenhagen | 5 | 0.5 | 1 | 813 |
| 13 | Univ Groningen, Fac Econ & Business | 5 | 0.5 | 7 | 98 |
| 14 | Maastricht Univ | 4 | 0.4 | 14 | 310 |
| 15 | NIMH, Expt Therapeut & Pathophysiol Branch | 4 | 0.4 | 0 | 54 |
| 16 | Oregon Hlth & Sci Univ | 4 | 0.4 | 0 | 384 |
| 17 | Stanford Univ | 4 | 0.4 | 0 | 84 |
| 18 | Univ bath, sch management | 4 | 0.4 | 0 | 53 |
| 19 | Univ calif los angeles | 4 | 0.4 | 0 | 919 |
| 20 | Univ cambridge, | 4 | 0.4 | 0 | 438 |
| 21 | Univ manchester, | 4 | 0.4 | 0 | 31 |
| 22 | Univ so calif, | 4 | 0.4 | 0 | 44 |
| 23 | Univ utah, | 4 | 0.4 | 4 | 153 |
| 24 | Univ utah, dept psychiat | 4 | 0.4 | 4 | 153 |
| 25 | Univ washington, sch med | 4 | 0.4 | 0 | 173 |
| 26 | Yale univ, sch med | 4 | 0.4 | 0 | 81 |
| 27 | Aston univ, aston business sch | 3 | 0.3 | 3 | 28 |
| 28 | Boston univ, sch med | 3 | 0.3 | 0 | 294 |
| 29 | Cleveland clin | 3 | 0.3 | 0 | 225 |
| 30 | Copenhagen business sch | 3 | 0.3 | 0 | 77 |
Table 9: Institution with subdivision wise of contribution
Conclusion
The number of papers published in “patent publication” has gradually increased during 2011-2020 and the study has shown that 1030 research documents have been published in patent publication during the period. 2020 has the highest number of research documents 247 (23.98%) with 2 of total local citation score and 637 total global citation score. Zhou Y is topmost author with published research records of 8 (0.8%) research papers contributed. It could be identified that the institutions wise analysis the following institutions Maastricht Univ, Univ Toronto Univ Utrecht, were acknowledged the most prolific institutions based on the number of research papers output they published.
References
- Alvi KS, Vinitha KS and Ravanan C. “World literature on hepatitis c virus research: a scientometric study”. Journal of Advances in Library and Information Science 3.4 (2104):361-368.
- Bhagat MP and Khaparde V. “A scientometric analysis of information in Ngo output reflected in pubmed database”. International Journal of All Research Education and Scientific Methods (IJARESM) 8.5 (2021):725-730.
[Crossref] [Google Scholar] [PubMed]
- Bhagat MP, Khaparde V and Santosh D. “Mapping of osteoarthritis research output at global level: a scientometric study”. International Journal of All Research Education and Scientific Methods (IJARESM) 9.8 (2021):64-76.
- Khaparde V and Pawar S. “Authorship pattern and degree of collaboration in Information Technology”. Journal of Computer Science and Information Technology 1.1 (2013):46-54.
- Landge RG and Khaparde V. “Postage stamps and digital philately of europe countries”. Information Technology and Computer 40.1 (2020):12-20.
- Namdeo GD and Khaparde V. “Mapping of plagiarism research output in India: A scientometric study”. Library of Progress-Library Science 39.2 (2019):377-388.
- Pandurang BM, Khaparde V and Alhamdi FA. “Naturopathy Output: A Scientometric Study in Scopus Database”. Pearl: A Journal of Library and Information Science 13.3 (2019):245-252.
- Yao Q and Chen K. “Scientometric trends and knowledge maps of Global health systems research”. Health Research Policy and Systems 12.1 (2014):1-20.
[Crossref] [Google Scholar] [PubMed]
- Santosh D, Vaishali SK and Ratnakar YM. “Mapping of coronavirus research output at global level: A scientometric study”. Library Philosophy and Practice (2020):1-13.
- Santosh D, Vaishali KS and Sagar AP. “Mapping of world publications: Sydenham chorea disease”. Library Progress (International) 40.1 (2020):34-43.
- Santosh D, Khaparde V and Mohankumar Z. “Organic farming research output at global level: A Scientometric study”. International Journal of Research and Analytical Reviews 5.3 (2018):1-9.
- Kai Hu, et al. “Analysis of the status and trend of GIs research in the past ten years from 2010 to 2019”. Remote Sensing and Spatial Information Sciences. 43.4 (2020):47-73.
- Tupe SK and Khaparde VS. “A scientometric evaluation of publications in stem cell regenerative medicine journals among german society 2009–2018”. International Journal of Library and Information Science (IJLIS) 8.3 (2019):16-25.
Author Info
Bhagat Meenakshi Pandurang* and Vaishali KhapardeReceived: 19-Sep-2022, Manuscript No. IJLIS-22-76246; Editor assigned: 22-Sep-2022, Pre QC No. IJLIS-22-76246(PQ); Reviewed: 06-Oct-2022, QC No. IJLIS-22-76246; Revised: 23-Dec-2022, Manuscript No. IJLIS-22-76246(R); Published: 03-Jan-2023, DOI: 10.35248/2231-4911.23.13.840
Copyright: This is an open access article distributed under the terms of the Creative Commons Attribution License, which permits unrestricted use, distribution, and reproduction in any medium, provided the original work is properly cited.
Call for Papers
Authors can contribute papers on
What is Your ORCID
Register for the persistent digital identifier that distinguishes you from every other researcher.
Social Bookmarking
Know Your Citation Style
American Psychological Association (APA)
Modern Language Association (MLA)
American Anthropological Association (AAA)
Society for American Archaeology
American Antiquity Citation Style
American Medical Association (AMA)
American Political Science Association(APSA)
