Research Article - (2021) Volume 11, Issue 3
Corona Virus Research in Veterinary Science a Scientometrics Analysis
S.Raju1* and M.Sankar2*Abstract
The present study explores the research output on corona virus in the different disciplines of veterinary science during 1989 to 2020 and Web of Science citation database used for this work. Results show that 1901 documents published in the study period and 6118 scientists/researchers published their research in this field. The present study was focused to analyses the collected data for year-wise output, source-wise, topmost journals, topmost author wise, institution wise, and keyword most occurrence in the research. Also, the present study reveals the interpretation of various citation scores in the scientometric aspects. In conclusion, the corona virus research output by Indian researchers for veterinary science was evidenced by the contribution of 158 research documents with Global Citation Scores of 1418 and Global Citation Score of 132. The quality research in all aspects of information would help in improving the productivity and also have a research impact.
Keywords
Scientometric Study, Corona Virus, Veterinary Science, Vaccines, Science Database, International Nuclear Information System Database (INIS).
Introduction
Recently, the corona virus is causing the most predominant diseases in the world. Most of the human beings and animals mostly infected by these viruses. Several researchers are working in different countries for complete eradication of these viral diseases from this world. Due to the pandemic situation, research is mainly focused on development of vaccines for human beings. However, the corona virus research in the veterinary discipline is also done by scientists and published their experimental results. Therefore, the present study is focused on veterinary science research with exclusive work on corona virus and data collected from the web of science database. One of the ways to analyses the quality of paper is its impact on the research. Scientometrics is used to determine the impact of research. For this study, the impact of corona virus research output published by Indian researchers at the national level as well as the international level was analyzed and reported.
Review of Related Literature
Kademani et al. (2006) analyzed the scientometric respect in nuclear science and technology research in India using International Nuclear Information System database (INIS) for a selective period (1970-2002). It is found that the average number of papers published per year was 1676.15. Most of the scientists published in the journals (60%) (Sankar, M & Srinivasaragavan 2012). The most preferred Journal was Pramana 1327 (3.955%), and more than 99 percent written in English. Sankar and Srinivasaragavan carryout out a scientometric study for authorship collaboration in agricultural research during 1970 – 2012, and the results showed a low level of publication in India as compared to the global level. Deals with sources authorship and metric related information also found in the result. It is also applied simple statistics and levels of local citation scores and global citation scores in the research.
Objectives of the study
1. To identify the year-wise distribution of output for corona virus research in veterinary science for India.
2. To identify the source-wise distribution for corona virus research in veterinary science for India.
3. To identify the topmost journal distribution in corona virus research output by Indian researchers.
4. To identify the topmost author-wise distribution for Indian researchers worked in the corona virus research in veterinary science.
5. To identify the frequency of institution-wise for corona virus research carried out in veterinary research field by Indian scientists.
6. To identify the frequency of keyword for corona virus research work found in Indian veterinary science researchers.
Methodology
The Web of Science (WoS) database is gaining more popular in India, which is a very user-friendly citation database as compared with other databases. The Web of knowledge is the search platform provided by Thomson Reuters (Kademani et al. 2006). For this study, the WoS online database was used to data collection on corona virus research done in the area of veterinary science by Indian researchers and used for further analysis (Shri Ram 2020). The period of study was chosen from January 1989 to 2020 September, and data collection restricted to this period only. The search string is the "corona virus" was used in WoS database and results showed 1901 records. The data was downloaded in the R-Programming software (Biblioshiny tool) and analyzed according to the objectives of the study in Table 1.
| S. No | Description | Results |
|---|---|---|
| 1 | Documents | 1901 |
| 2 | Sources (Journals, Books, etc.) | 151 |
| 3 | Keywords plus (ID) | 2920 |
| 4 | Author's keywords (DE) | 2604 |
| 5 | Average citations per documents | 17.21 |
| 6 | Authors | 6118 |
| 7 | Author appearances | 9641 |
| 8 | Authors of single-authored documents | 119 |
| 9 | Authors of multi-authored documents | 5999 |
| 10 | Single-authored documents | 164 |
| 11 | Documents per author | 0.311 |
| 12 | Authors per document | 3.22 |
| 13 | Co-authors per documents | 5.07 |
| 14 | Collaboration Index | 3.45 |
Table 1: Basic Data of Corona Virus Research Output for Published by India Veterinary Scientists during 1989-2020
Data analysis and interpretation
The impact of specific area of research can be assessed by counting the number of research documents published in that field, citation scores and scholar indices. Table 1 gives the details about year wise research documents and means value of total citation article scores and total citations per year scores for corona virus research works done by India veterinary scientists during 1989-2020. (Farshid Danesh & Somayeh Ghavi Del 2020) the study results reveals that articles published 55 numbers in 2006 and Mean TC per Art 30.58181818, Mean TC per Year 2.184415584 the citable year is 14. The maximum and minimum number of research documents found as 108 and 14 for 2020 and 2004, respectively. (Siva Sami, K. 2016) More than 20 records found as a yearly research output in corona virus research in veterinary science in India. Furthermore, it was found those citable years in Table 2.
| S. No | Year | Article | Mean TC per art | Mean TC per year | Citable years |
|---|---|---|---|---|---|
| 1 | 1989 | 26 | 15.38461538 | 0.496277916 | 31 |
| 2 | 1990 | 32 | 15.2812500 | 0.50937500 | 30 |
| 3 | 1991 | 51 | 17.68627451 | 0.609871535 | 29 |
| 4 | 1992 | 49 | 26.53061224 | 0.947521866 | 28 |
| 5 | 1993 | 62 | 25.74193548 | 0.953405018 | 27 |
| 6 | 1994 | 41 | 16.31707317 | 0.627579737 | 26 |
| 7 | 1995 | 53 | 19.20754717 | 0.768301887 | 25 |
| 8 | 1996 | 45 | 20.86666667 | 0.869444444 | 24 |
| 9 | 1997 | 56 | 22.71428571 | 0.98757764 | 23 |
| 10 | 1998 | 37 | 24.94594595 | 1.133906634 | 22 |
| 11 | 1999 | 51 | 23.54901961 | 1.121381886 | 21 |
| 12 | 2000 | 53 | 28.56603774 | 1.428301887 | 20 |
| 13 | 2001 | 61 | 23.98360656 | 1.262295082 | 19 |
| 14 | 2002 | 48 | 25.91666667 | 1.439814815 | 18 |
| 15 | 2003 | 43 | 21.81395349 | 1.283173735 | 17 |
| 16 | 2004 | 51 | 24.25490196 | 1.515931373 | 16 |
| 17 | 2005 | 46 | 26.36956522 | 1.757971014 | 15 |
| 18 | 2006 | 55 | 30.58181818 | 2.184415584 | 14 |
| 19 | 2007 | 70 | 27.27142857 | 2.097802198 | 13 |
| 20 | 2008 | 64 | 22.90625000 | 1.908854167 | 12 |
| 21 | 2009 | 58 | 18.70689655 | 1.700626959 | 11 |
| 22 | 2010 | 59 | 17.57627119 | 1.757627119 | 10 |
| 23 | 2011 | 46 | 15.73913043 | 1.748792271 | 9 |
| 24 | 2012 | 67 | 16.14925373 | 2.018656716 | 8 |
| 25 | 2013 | 71 | 15.8028169 | 2.257545272 | 7 |
| 26 | 2014 | 97 | 13.74226804 | 2.290378007 | 6 |
| 27 | 2015 | 88 | 12.94318182 | 2.588636364 | 5 |
| 28 | 2016 | 102 | 7.901960784 | 1.975490196 | 4 |
| 29 | 2017 | 105 | 6.171428571 | 2.057142857 | 3 |
| 30 | 2018 | 92 | 2.739130435 | 1.369565217 | 2 |
| 31 | 2019 | 108 | 0.962962963 | 0.962962963 | 1 |
| 32 | 2020 | 14 | 0.214285714 | 0 | 0 |
Table 2: Year Wise Documents with Citation of Corona Virus Research in Veterinary Science
Generally, several numbers of scholar indices (h, g and m index of the author) used to measure the bibliometric impact of individual scientist or researcher. The results reveals that the author SAIF LJ holds first place (h index of 28, g index of 39 and 0.875)by contributing 62 papers with 1812 citations in Table 3.
| S. No | Author | H_index | G_index | M_index | TC | NP | PY_start |
|---|---|---|---|---|---|---|---|
| 1 | Saif Lj | 28 | 39 | 0.875 | 1812 | 62 | 1989 |
| 2 | Paltrinieri S | 15 | 22 | 0.535714286 | 533 | 32 | 1993 |
| 3 | Decaro N | 15 | 25 | 0.789473684 | 644 | 28 | 2002 |
| 4 | Addie Dd | 15 | 25 | 0.483870968 | 643 | 26 | 1990 |
| 5 | Buonavoglia C | 17 | 26 | 0.772727273 | 807 | 26 | 1999 |
| 6 | Hartmann K | 12 | 22 | 0 | 497 | 26 | 0 |
| 7 | Pedersen Nc | 17 | 25 | 0.653846154 | 1028 | 25 | 1995 |
| 8 | Jackwood Mw | 16 | 24 | 0.571428571 | 980 | 24 | 1993 |
| 9 | Cavanagh D | 16 | 20 | 0.551724138 | 1650 | 20 | 1992 |
| 10 | Lutz H | 14 | 19 | 0.451612903 | 569 | 19 | 1990 |
| 11 | Martella V | 12 | 18 | 0.6 | 537 | 18 | 2001 |
| 12 | Giordano A | 9 | 15 | 0.473684211 | 243 | 17 | 2002 |
| 13 | Hohdatsu T | 9 | 17 | 0.3 | 352 | 17 | 1991 |
| 14 | Liu Sw | 12 | 17 | 0.705882353 | 417 | 17 | 2004 |
| 15 | Mari V | 12 | 17 | 0.857142857 | 357 | 17 | 2007 |
| 16 | Mostl K | 6 | 12 | 0.187500000 | 150 | 17 | 1989 |
| 17 | Toro H | 9 | 14 | 0.6 | 215 | 17 | 2006 |
| 18 | Han Zx | 11 | 16 | 0.733333333 | 295 | 16 | 2006 |
| 19 | Brandao Pe | 6 | 11 | 0.428571429 | 127 | 15 | 2007 |
| 20 | Elia G | 12 | 15 | 0.6 | 399 | 15 | 2001 |
Table 3: Author Wise H-Index, G-Index-Index of Corona Virus Research in Veterinary Science (Top 20)
The highest research documents were published as 108 in 2019, followed by 2017 (n=105) and 2016 (n=102). It was observed that the number of published documents was found higher for 2013-2019 that of previous years. However, lesser number of publications found 2020 was due to data collected for nine months in 2020 in Table 4.
| S. No | Author | year | freq | TC | TCpY |
|---|---|---|---|---|---|
| 1 | Addie dd | 1990 | 1 | 15 | 0.483870968 |
| 2 | Addie dd | 1992 | 2 | 139 | 4.793103448 |
| 3 | Addie dd | 1993 | 1 | 4 | 0.142857143 |
| 4 | Addie dd | 1994 | 1 | 0 | 0 |
| 5 | Addie dd | 1995 | 3 | 83 | 3.192307692 |
| 6 | Addie dd | 1996 | 1 | 18 | 0.72 |
| 7 | Addie dd | 1997 | 1 | 80 | 3.333333333 |
| 8 | Addie dd | 1998 | 1 | 18 | 0.782608696 |
| 9 | Addie dd | 2000 | 2 | 64 | 3.047619048 |
| 10 | Addie dd | 2001 | 1 | 55 | 2.75 |
| 11 | Addie dd | 2002 | 1 | 44 | 2.315789474 |
| 12 | Addie dd | 2004 | 5 | 77 | 4.529411765 |
| 13 | Addie dd | 2005 | 1 | 18 | 1.125 |
| 14 | Addie dd | 2012 | 1 | 6 | 0.666666667 |
| 15 | Addie dd | 2013 | 1 | 9 | 1.125 |
Table 4: Individual Authors-Frequency Year Wise (Top 15)
The second place lotka’s law-author productivity for paltrinieri s (h index of 15, g index of 22 and 0.535714286) for his 32 research papers, which was cited by 533 documents. The author, Kumar S ranked third place with a research output of 28 papers with 644 citations (h index 15.g index 25 and 0.789473684) in Table 5.
| Documents | No. of authors | Proportion of authors |
|---|---|---|
| 1 | 4633 | 0.757273619 |
| 2 | 844 | 0.13795358 |
| 3 | 268 | 0.043805165 |
| 4 | 142 | 0.023210199 |
| 5 | 73 | 0.011932004 |
| 6 | 42 | 0.006864989 |
| 7 | 26 | 0.004249755 |
| 8 | 25 | 0.004086303 |
| 9 | 13 | 0.002124877 |
| 10 | 10 | 0.001634521 |
| 11 | 8 | 0.001307617 |
| 12 | 4 | 0.000653808 |
| 13 | 2 | 0.000326904 |
| 14 | 3 | 0.000490356 |
| 15 | 7 | 0.001144165 |
| 16 | 1 | 0.000163452 |
| 17 | 6 | 0.000980713 |
| 18 | 1 | 0.000163452 |
| 19 | 1 | 0.000163452 |
| 20 | 1 | 0.000163452 |
| 24 | 1 | 0.000163452 |
| 25 | 2 | 0.000326904 |
| 26 | 2 | 0.000326904 |
| 28 | 1 | 0.000163452 |
| 29 | 1 | 0.000163452 |
| 30 | 1 | 0.000163452 |
Table 5: Lotka’s Law-Author Productivity
Bradford's law applied corona virus research in veterinary science predicts that the number of alternate and third zones will be n and n2 times larger than the first zone independently and thus, it should be possible to prognosticate the total number of papers on a subject once the number in the core and middle zone in Table 6.
| S.No | Source | Rank | Freq | cumFreq | Zone |
|---|---|---|---|---|---|
| 1 | Veterinary Microbiology | 1 | 191 | 191 | Zone 1 |
| 2 | AVIAN Diseases | 2 | 115 | 306 | Zone 1 |
| 3 | Journal of Veterinary Medical Science | 3 | 85 | 391 | Zone 1 |
| 4 | Journal of Veterinary Diagnostic Investigation | 4 | 83 | 474 | Zone 1 |
| 5 | AVIAN Pathology | 5 | 73 | 547 | Zone 1 |
| 6 | Veterinary Record | 6 | 67 | 614 | Zone 1 |
| 7 | Journal of Feline Medicine And Surgery | 7 | 64 | 678 | Zone 1 |
| 8 | Journal of Wildlife Diseases | 8 | 51 | 729 | Zone 2 |
| 9 | American Journal of Veterinary Research | 9 | 49 | 778 | Zone 2 |
| 10 | Transboundary and Emerging Diseases | 10 | 44 | 822 | Zone 2 |
| 11 | Veterinary Immunology and Immunopathology | 11 | 44 | 866 | Zone 2 |
| 12 | Veterinary Journal | 12 | 42 | 908 | Zone 2 |
| 13 | Bmc Veterinary Research | 13 | 41 | 949 | Zone 2 |
| 14 | Veterinary Research | 14 | 41 | 990 | Zone 2 |
| 15 | Research in Veterinary Science | 15 | 38 | 1028 | Zone 2 |
| 16 | Canadian Journal of Veterinary Research-Revue Canadienne De Recherche Veterinaire | 16 | 30 | 1058 | Zone 2 |
| 17 | Laboratory Animal Science | 17 | 29 | 1087 | Zone 2 |
| 18 | Preventive Veterinary Medicine | 18 | 28 | 1115 | Zone 2 |
| 19 | Veterinary Pathology | 19 | 25 | 1140 | Zone 2 |
| 20 | Zoonoses And Public Health | 20 | 23 | 1163 | Zone 2 |
| 21 | Journal Of Comparative Pathology | 21 | 22 | 1185 | Zone |
| 22 | Journal of Veterinary Internal Medicine | 22 | 22 | 1207 | Zone 2 |
| 23 | Magyar Allatorvosok Lapja | 23 | 22 | 1229 | Zone 2 |
| 24 | Acta Veterinaria Hungarica | 24 | 21 | 1250 | Zone 2 |
| 25 | Canadian Veterinary Journal-Revue Veterinaire Canadienne | 25 | 21 | 1271 | Zone 2 |
| 26 | Feline Practice | 26 | 19 | 1290 | Zone 2 |
| 27 | Acta Veterinaria Scandinavica | 27 | 17 | 1307 | Zone 3 |
| 28 | Journal of Veterinary Medicine Series B-Infectious Diseases And Veterinary Public Health | 28 | 17 | 1324 | Zone 3 |
| 29 | Australian Veterinary Journal | 29 | 16 | 1340 | Zone 3 |
| 30 | Revue Scientifique Et Technique-Office International Des Epizooties | 30 | 16 | 1356 | Zone 3 |
Table 6: Bradford Law Applied Corona Virus Research in Veterinary Science
Bradford law zone wise source and records have veterinary microbiology AVIAN diseases journal of veterinary medical science and AVIAN pathology in Table 7 and Figure 1.
| Zone | Source | Records |
|---|---|---|
| I (Core) | 7 | 678 |
| II | 19 | 612 |
| III | 125 | 611 |
Table 7: Bradford Law Zone Wise Source and Records
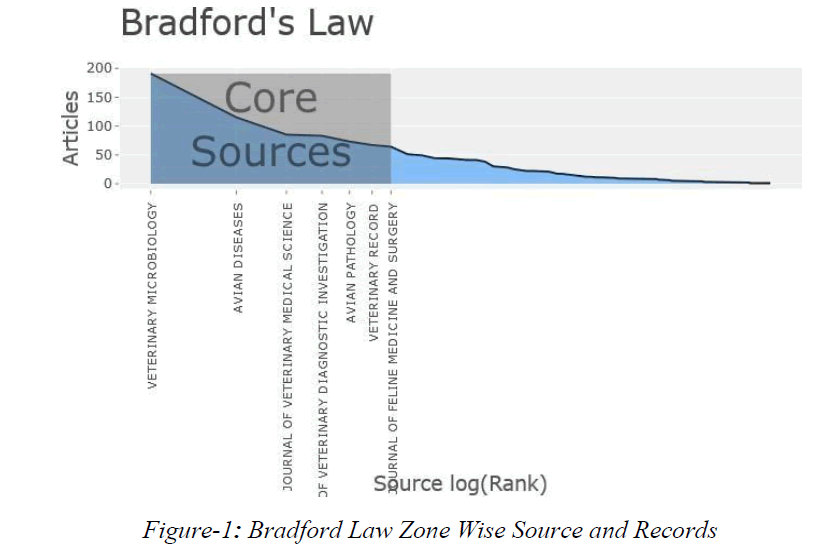
Figure 1: Bradford Law Zone Wise Source and Records
First rank for Veterinary Microbiology journal is the highly productive journal with h index 34, g index 47 and 191 publications and recorded 3910 Citations, followed by AVIAN DISEASES journal (hindex 29, g index 47 and 115 publications and 2789 Citations). Third rank reserved for journal of veterinary medical science due to its hindex of 17, g index of 27, 85 publications with 990 Citations in Table 8 and Figure 2.
| Year | Veterinary microbiology | Journal of veterinary medical science | AVIAN pathology | Journal of veterinary diagnostic investigation | AVIAN diseases |
|---|---|---|---|---|---|
| 1989 | 7 | 0 | 0 | 0 | 0 |
| 1990 | 3 | 0 | 0 | 0 | 2 |
| 1991 | 6 | 4 | 0 | 2 | 2 |
| 1992 | 5 | 4 | 2 | 1 | 2 |
| 1993 | 5 | 4 | 0 | 2 | 1 |
| 1994 | 5 | 2 | 0 | 1 | 1 |
| 1995 | 4 | 3 | 2 | 3 | 0 |
| 1996 | 2 | 4 | 3 | 4 | 0 |
| 1997 | 2 | 3 | 3 | 1 | 6 |
| 1998 | 3 | 2 | 0 | 2 | 3 |
| 1999 | 4 | 3 | 0 | 6 | 0 |
| 2000 | 2 | 2 | 2 | 2 | 11 |
| 2001 | 2 | 3 | 4 | 2 | 11 |
| 2002 | 2 | 0 | 2 | 7 | 8 |
| 2003 | 5 | 1 | 3 | 4 | 6 |
| 2004 | 3 | 4 | 2 | 1 | 2 |
| 2005 | 3 | 1 | 3 | 3 | 3 |
| 2006 | 1 | 1 | 7 | 2 | 3 |
| 2007 | 11 | 4 | 6 | 2 | 5 |
| 2008 | 9 | 5 | 4 | 2 | 3 |
| 2009 | 6 | 4 | 3 | 2 | 3 |
| 2010 | 8 | 2 | 2 | 4 | 4 |
| 2011 | 6 | 2 | 4 | 3 | 2 |
| 2012 | 6 | 1 | 2 | 4 | 6 |
| 2013 | 11 | 3 | 3 | 2 | 5 |
| 2014 | 9 | 2 | 3 | 5 | 4 |
| 2015 | 11 | 0 | 2 | 4 | 5 |
| 2016 | 13 | 7 | 2 | 3 | 7 |
| 2017 | 16 | 5 | 4 | 3 | 5 |
| 2018 | 4 | 4 | 3 | 4 | 3 |
| 2019 | 14 | 5 | 2 | 2 | 2 |
| 2020 | 3 | 0 | 0 | 0 | 0 |
Table 8: Source Dynamics of Corona Virus Research in Veterinary Science
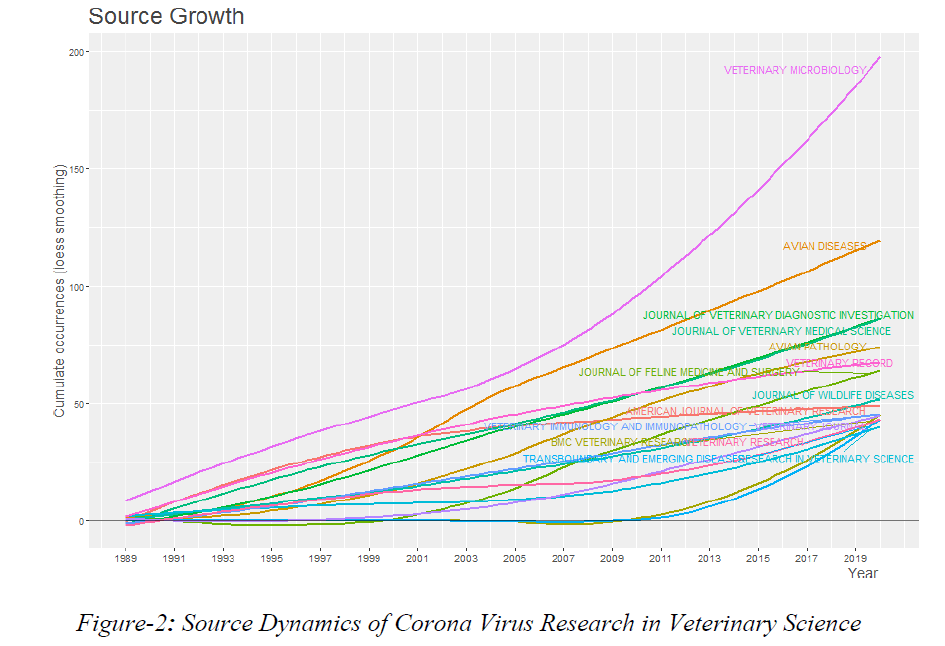
Figure 2: Source Dynamics of Corona Virus Research in Veterinary Science
The top most journals are published in the corona virus research in veterinary Science In the study, highly productive open access journals of corona virus research papers were identified, and it was found that these journals collectively contributed immensely overall view about the impact of the most productive journals in Table 9.
| S. No | Source | h_index | g_index | m_index | TC | NP | PY_start |
|---|---|---|---|---|---|---|---|
| 1 | Veterinary Microbiology | 34 | 47 | 1.0625 | 3910 | 191 | 1989 |
| 2 | AVIAN Diseases | 29 | 47 | 0.935483871 | 2789 | 115 | 1990 |
| 3 | Journal of Veterinary Medical Science | 17 | 27 | 0.566666667 | 990 | 85 | 1991 |
| 4 | Journal of Veterinary Diagnostic Investigation | 22 | 39 | 0.733333333 | 1770 | 83 | 1991 |
| 5 | AVIAN Pathology | 31 | 53 | 1.068965517 | 2957 | 73 | 1992 |
| 6 | Veterinary Record | 26 | 40 | 0.81250000 | 1777 | 67 | 1989 |
| 7 | Journal Of Feline Medicine And Surgery | 20 | 33 | 1 | 1300 | 64 | 2001 |
| 8 | Journal of Wildlife Diseases | 22 | 32 | 0.733333333 | 1140 | 51 | 1991 |
| 9 | American Journal of Veterinary Research | 21 | 29 | 0.65625 | 1039 | 49 | 1989 |
| 10 | Transboundary And Emerging Diseases | 13 | 22 | 1.3 | 582 | 44 | 2011 |
| 11 | Veterinary Immunology And Immunopathology | 20 | 31 | 0.666666667 | 1058 | 44 | 1991 |
| 12 | Veterinary Journal | 19 | 31 | 0.863636364 | 1047 | 42 | 1999 |
| 13 | Bmc Veterinary Research | 13 | 17 | 1.625 | 397 | 41 | 2013 |
| 14 | Veterinary Research | 14 | 33 | 0.5 | 110 | 41 | 1993 |
| 15 | Research in Veterinary Science | 14 | 25 | 0.4375 | 682 | 38 | 1989 |
Table 9: Source Impact of Corona Virus Research in Veterinary Science
Country wise collaboration of corona virus research in veterinary Science Among the country wise collaboration of Coronavirus research covered by the study tops United States of America with highest number of publications in 491, UK 135, China 134, Japan 132, Germany 91,Italy 88, Canada 81, Brazil 62, France 58. These countries are top ten places in the Corona virus research in veterinary Science in Table 10 and Figure 3.
| Country | Articles | Freq | SCP | MCP | MCP_Ratio |
|---|---|---|---|---|---|
| Usa | 491 | 0.265693 | 331 | 160 | 0.3259 |
| United Kingdom | 135 | 0.073052 | 84 | 51 | 0.3778 |
| China | 134 | 0.072511 | 126 | 8 | 0.0597 |
| Japan | 132 | 0.071429 | 110 | 22 | 0.1667 |
| Germany | 91 | 0.049242 | 56 | 35 | 0.3846 |
| Italy | 88 | 0.047619 | 79 | 9 | 0.1023 |
| Canada | 81 | 0.043831 | 50 | 31 | 0.3827 |
| Brazil | 62 | 0.03355 | 51 | 11 | 0.1774 |
| France | 58 | 0.031385 | 27 | 31 | 0.5345 |
| Korea | 57 | 0.030844 | 52 | 5 | 0.0877 |
| Australia | 41 | 0.022186 | 29 | 12 | 0.2927 |
| Belgium | 40 | 0.021645 | 26 | 14 | 0.35 |
| Hungary | 36 | 0.019481 | 24 | 12 | 0.3333 |
| Spain | 34 | 0.018398 | 22 | 12 | 0.3529 |
| Sweden | 31 | 0.016775 | 21 | 10 | 0.3226 |
| Turkey | 31 | 0.016775 | 27 | 4 | 0.129 |
| Switzerland | 29 | 0.015693 | 15 | 14 | 0.4828 |
| Netherlands | 28 | 0.015152 | 14 | 14 | 0.5 |
Table 10: Country Wise Collaboration of Corona Virus Research in Veterinary Science

Figure 3: Country Wise Collaboration of Corona Virus Research in Veterinary Science
Results and Discussion
Based on the analysis of corona virus research output has interpreted, and their citation scores emphasized at the national level as well as the international level. The present study analyses the corona virus research output in veterinary science for the study period starting from 1989-2020. The data collected from the WoS database was used for analysis. The overall documents available in 1901 No’s, various sources of research 151 No’s using keywords 2920 Average citation per document 17.21, Authors 6118, Authors of single-authored documents 119, Authors of multi-authored documents 5999, Documents per Author 0.3111, Authors per Document 3.22, Co- Authors per Documents 5.07 and Collaboration Index 3.45.
Conclusion
Furthermore, the research articles are a significant primary source of publication among the four types of research documents published in the area of corona virus research. The excellent quality research in all aspects of information would help in improving the productivity and also have a research impact.
References
- Sankar, M & Srinivasaragavan, S (2012) A Scientometric Study of Authorship Collaboration in Agricultural Research from 1970 – 2012. Asian Journal of Information Science and Technology, pp. 22-31.
- Kademani et al. (2006) Scientometric dimensions of Nuclear Science and Technology,Research in India: A study based INIS (1970-2002) database. Malaysian Journal of Library and Information Science 11(1), 23-48.
- Year Bibliometric Shri Ram (2020) Coronavirus Research Trends: A 50–210–226.
- Assessment, Science & Technology Libraries. Farshid Danesh & Somayeh Ghavi Del (2020) Coronavirus: Scientometrics of 50 Years of Global Scientific Productions14(1): 1-16
- Siva Sami, K. (2016) Scientometrics Profile of Ebola Research Output. Paripex–Indian Journal of Research 5(6), 208-211
Author Info
S.Raju1* and M.Sankar2*2Agricultural College & Research Institute, Agricultural University, Thiruvannamalai, Tamil Nadu, India
Received: 04-Jun-2021 Published: 25-Jun-2021
Copyright: This is an open access article distributed under the terms of the Creative Commons Attribution License, which permits unrestricted use, distribution, and reproduction in any medium, provided the original work is properly cited.
Call for Papers
Authors can contribute papers on
What is Your ORCID
Register for the persistent digital identifier that distinguishes you from every other researcher.
Social Bookmarking
Know Your Citation Style
American Psychological Association (APA)
Modern Language Association (MLA)
American Anthropological Association (AAA)
Society for American Archaeology
American Antiquity Citation Style
American Medical Association (AMA)
American Political Science Association(APSA)
