Review Article - (2025) Volume 14, Issue 1
Comparative Evaluation of Citation Analysis of Mechanical Engineering Theses: A Study to the Energy, Industrial and Production Engineering to Students in 2011-2020 GNDEC
Manpreet Singh* and Rajinder SharmaAbstract
The present study is based on 11502 citations are appended to the theses of 5 energy engineering, 343 production engineering, and 169 industrial engineering submitted to Engineering GNDEC for the award of thesis during the period of 2011-2020. According to the study, Journals 5069 other sources, 4349 others citation, conference document 938 were the most preferred sources of mechanical engineering researchers, accounting for 11502 of total citations, followed by books with 588 citations. Citation analysis is carried out on all journal articles published in the journal of energy, production engineering and Industrial (ME) 2011-2020. The study concludes that, together with other approaches, citation analysis remains one of the most important tools to assess the usefulness of library holdings for M. Tech students in the activities of mechanical.
Keywords
Citation analysis, Production engineering, Industrial engineering, Energy engineering, Theses students, GNDEC
Introduction
Citation analysis is an interesting area of study. Citation analysis is the study of the references or citations that is included in the research communication. Citation analysis examines the use of references or literature in journals, theses, and other materials. The frequency of the journal title, type and age of the resources used, place of publication, language, and frequency of the author are all studied when analyzing citations to suggest ways to improve the library. Citation analysis involves looking at the pattern and frequency of citations in books and articles.
Citation analysis
Citation analysis and application of citation-based techniques such as direct citation, co-citation, and bibliographic coupling to understand the structure of science have a long history. An area of bibliometrics that studies the citations to and from documents. Citation analysis applies various techniques such as citation counts that can help establish scholarship influence and patterns. Unlike traditional database searching by author or subject, citation searching tracks where works such as journals, books, conference proceedings, symposiums, transactions, and theses have been cited by other authors.
Definitions of citation analysis
Martin defined citation analysis, “as an activity involving analysis of citation and references which forms a part of primary scientific communication.”
Ravichandra Rao “by citation analysis one can evaluate and interpret citations received by articles, authors, institutions and another aggregate of scientific activity.
Literature Review
In the library literature, a vast majority of citation studies have explored M. Tech students characteristics and information needs, using theses and dissertations as data sources.
Definition of a journal: A Journal is a scholarly publication containing articles written by researchers, professors and other experts. Journals focus on a specific discipline or field of study. Manpreet Singh M.Tech student’s use of library resources, the age resources is an essential factor in citation analysis. In postgraduate students' use of library resources, the age of resources is also an important factor in citation analysis. Environment is the subject of the study. Environment 50 (13.66%) geotechnical 113 (30.87) 53 (14.84%)-soil mechanics structural engineering 147 (40.16%) and structural engineering 147 (40.16%). K. P. Singh and Bebi study about citation analysis of PhD thesis in Sociology Submitted to University of Delhi during 1995-2010.
The study presents analysis of several parameters like authorship pattern, forms of literature, country wise scattering of citations, distribution of Indian and foreign citations and a ranked list of top 30 cited sociology journals. The study finds that highest number of citations was single authored (83.94 %), and 67.23 % citations were from books and only 22.20 % citations were from journals [1].
K.Kumar and Reddy, T. R. explain the study on citations in master's degree thesis submittedto the department of library and information science, Sri Venkateswara university, Tirupathibetween 2000 and 2007, were analyzed for possible relationships between citing, citingarticles, and bibliographic forms. Data was analyzed using frequency and percentagedistributions (presented in charts, tables, and graphs), as well as measures of centraltendency. According to the findings, journals were the most frequently used referencematerials in the thesis. Anaehobi, E. S. and Muokebe Bibiana document analysis wasemployed to extract data from all the Masters theses submitted to Festus Aghagbo NwakoLibrary. A total of 87 documents were studied and 2949 citations were recorded. Theanalysis and organization of data were done through the use of frequency tables andpercentages. The result indicated that Internet resources had the least citation with (12.14%),books (54.09%).
Guru Nanak Dev engineering college
Guru Nanak Dev engineering college was established in 1956. The Nanakana Sahib education trust resisted the trust deed on February 24, 1953, with a commitment to uplift the vast weaker section of Indian polity comprising rural India by admitting 70% of students from rural areas every year. The college is affiliated with Punjab technical university, Jalandhar, and offers B. Tech., M. Tech., MBA and MCA programmers. The faculty of engineering is one of six faculties at GNDEC and offers applied science, civil engineering, computer engineering, electoral engineering, electronics and Com. Engineering, information engineering, mechanical engineering, production engineering, BCA, BBA, MCA and MBA.
The institution has a well-established air conditioned central library having a rich collection of books, online books, print journals, online journals, online journals, back volume journals. The books are classified according to DDC 23rd latest edition through web Dewey service[2]. Library is fully computerized with e-Granthalaya software package which is an integrated multi-user library management system that supports all in-house operations of the Library. Library collection can also be accessed through Web OPAC at any terminal on the campus network. Library is also connected with DELNET for inter library loan and document delivery services. Library resources which include some of the leading IEEE, ASCE, ASME, J-Gate engineering, Wiley eBook, Pearson education book, McGraw hill book and EBSCO. The library shall be managed and administered by a library committee under the supervision and control of the board of management. The library has created an institutional repository on open source software "D Space" which serves as a platform for accessing the scholarly contents generated by the GNDEC community [3].
Department of mechanical engineering
The department of mechanical engineering, production engineering, and industrial engineering is revitalized into cutting-edge research and provides cutting edge education. We attract some of the brightest students and faculty and we invite you to join us in the excitement.
Objectives:
•To determine the yearly distribution of these, submit industrial and production.
•To study if different sources of information were used by mechanical M.Tech inconducting research.
•To know the nature of authorship patterns.
•To study bibliometrics, citation analysis and the significance of citations.
•To identify the most important journals in the field.
Methodology
Form 1 shows the year wise distribution of thesis submitted by the department of energy, industrial and production engineering.
Every article published during the study period was examined. Title pages and reference sections were photocopied from each of the 11502 journals published by the journal the study. The is journal of data on the total number of articles, citations, and different sources cited, as well as dates of publication of such references, with an authorship pattern for each article.
M.Tech Theses
From Table 1 shows production 343 (2.98%) industrial 169 (1.46%) and energy 5 (0.04%) thesis with a total of 11502 citations representing three engineering disciplines: Energy engineering, production engineering, industrial engineering. According to the table, research have used a maximum of 5069 journals (44.07%) 4349 other sources (37.81%) 938 conferences (8.15%), 588 books (5.11%) 183 theses (1.59%) 25 (0.22) Ph.d (Figure 1).
| S. No | No. of citation | Mechanical | Age% | Citation | Age% |
|---|---|---|---|---|---|
| 1 | Book | 588 | 5.11 | 588 | 5.2 |
| 2 | Conference | 938 | 8.15 | 1526 | 13.43 |
| 3 | Journal | 5069 | 44.07 | 6595 | 57.85 |
| 4 | Link | 140 | 1.21 | 6735 | 59.05 |
| 5 | Magazines | 37 | 0.32 | 6772 | 59.38 |
| 6 | Symposium | 45 | 0.39 | 6817 | 59.76 |
| 7 | Transactions | 128 | 1.11 | 6945 | 60.85 |
| 8 | Thesis | 183 | 1.59 | 7128 | 62.43 |
| 9 | Ph.d | 25 | 0.21 | 7153 | 62.65 |
| 10 | others | 4349 | 37.81 | 11502 | 99.97 |
| Total | 11502 | 99.97% | 99.97% |
Table 1: Form wise distribution.
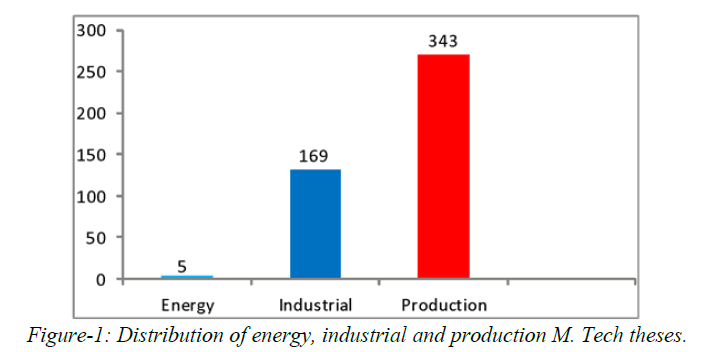
Figure 1: Distribution of energy, industrial and production M. Tech theses.
Table 2 the distribution of departmental theses from the GNDEC energy, industrial and production engineering submitted from 2011 to 2020. During the year 2011-20, the journal received 5069 (44.07%), others received 4329 (37.81%), conference received 938 (8.15%), and book received 588 (5.11%), Thesis (1.59%), links received 183 (1.21%), symposiums received 45 (0.39%), magazines received 37 (0.32%), and Ph.D. received 25 (0.21%) (Figures 2 and 3) [4].
| Year | Book | Confer | Journal | Link | Maga | Sympo | Trans | Thesis | Ph.d | Others | Citation |
|---|---|---|---|---|---|---|---|---|---|---|---|
| 2010-11 | 89 | 66 | 382 | 5 | 11 | 5 | 1 | 7 | 3 | 172 | 741 |
| 2012-12 | 46 | -- | 312 | 10 | -- | 3 | 2 | 13 | 1 | 308 | 695 |
| 2013-13 | 53 | 51 | 458 | 10 | -- | 3 | 29 | 9 | 2 | 245 | 860 |
| 2014-14 | 68 | 9 | 308 | -- | 6 | 4 | 2 | 12 | 2 | 265 | 676 |
| 2015-15 | 45 | 62 | 335 | 12 | -- | 4 | 11 | 11 | 2 | 243 | 726 |
| 2016-16 | 28 | 85 | 400 | 20 | 1 | -- | 7 | 12 | 2 | 393 | 948 |
| 2017-17 | 49 | 78 | 610 | 6 | -- | 3 | 8 | 9 | 4 | 463 | 1230 |
| 2018-18 | -- | 37 | 90 | -- | -- | 1 | 2 | 3 | 1 | 77 | 211 |
| 2019-19 | 33 | 53 | 237 | 3 | 11 | -- | 7 | 3 | -- | 366 | 713 |
| 2020-20 | 15 | 8 | 63 | -- | -- | -- | 3 | -- | -- | 92 | 181 |
| Total | 426 | 449 | 3195 | 66 | 29 | 23 | 72 | 79 | 17 | 2624 | 6981 |
| -6.11 | -6.44 | -45.83 | -0.94 | -0.41 | -0.32 | -1.03 | -1.13 | -0.24 | -37.58 | -100 |
Table 2: Form wise distribution.
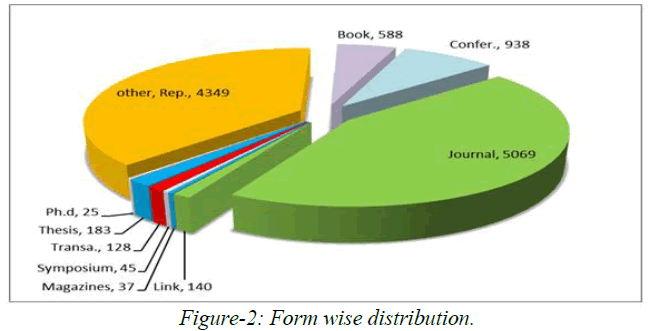
Figure 2: Form wise distribution.
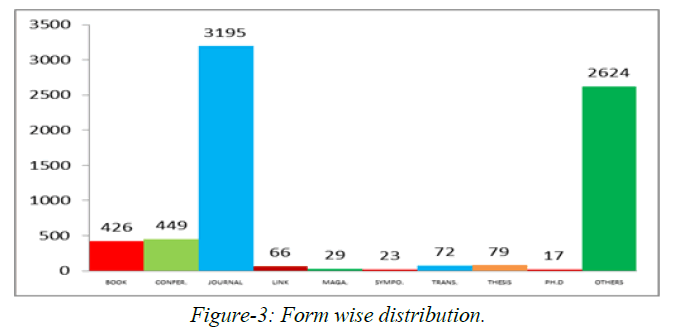
Figure 3: Form wise distribution.
Discussion
The Table 3 shows the total number of citations for the 6981 to 463 (17.61%) of citations occurring in the year 2017-17 and 92 (1.31%) in the year 2020. The Table 3 shows other sources account for 3195 of the citations in their theses (45.83%). According to the findings for cited sources in a mechanical engineering thesis, production provides access to 45.83% of the others (37.58%) of the cited journal titles and conferences (6.44%) (Figure 4). Journals get the highest number of citations used by researchers in industrial engineering accounting for 2624 (37.58%), followed by conferences with (6.44%) 479, books with (6.11%) 426, thesis 99, and theses with the least number of citations used by researchers (1.61%) 70 [5].
| Year | Book | Confer | Journal | Link | Maga | Sympo | Trans | Thesis | Ph.d | Others | Citation |
|---|---|---|---|---|---|---|---|---|---|---|---|
| 2010-11 | 14 | 45 | 154 | -- | -- | 1 | 6 | 8 | -- | 62 | 290 |
| 2012-12 | 26 | 72 | 147 | -- | -- | -- | 10 | 16 | 3 | 170 | 444 |
| 2013-13 | 42 | 71 | 384 | 21 | -- | 3 | 9 | 19 | 1 | 471 | 1021 |
| 2014-14 | 6 | 104 | 294 | 15 | -- | 7 | 10 | 21 | -- | 193 | 650 |
| 2015-15 | 21 | 38 | 298 | 7 | -- | 3 | 10 | 1 | 3 | 290 | 671 |
| 2016-16 | 26 | 54 | 206 | 19 | 7 | 3 | -- | 26 | 1 | 111 | 449 |
| 2017-17 | 5 | 19 | 127 | 3 | -- | 1 | 3 | 1 | -- | 122 | 281 |
| 2018-18 | 10 | 48 | 133 | -- | -- | 2 | 3 | 3 | -- | 74 | 273 |
| 2019-19 | 1 | 17 | 40 | 4 | 1 | -- | -- | 2 | -- | 61 | 131 |
| 2020-20 | 11 | 6 | 35 | -- | -- | -- | -- | -- | -- | 34 | 86 |
| Total | 162 | 479 | 1818 (41.88) | 70 | 08 (0.18) | 20 | 51 (1.17) | 99 (2.28) | 08 (0.18) | 1619 | 4340 |
| -3.73 | -11.03 | -1.61 | -0.46 | -36.86 | 99.38 |
Table 3: Industrial engineering.
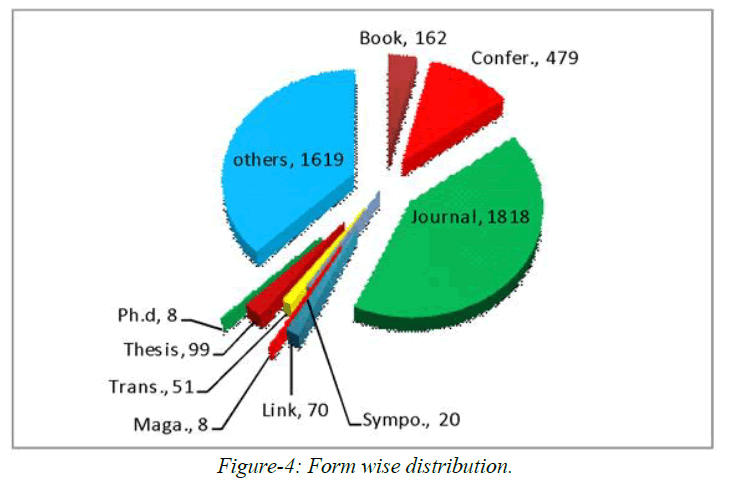
Figure 4: Form wise distribution.
The Table 4 shows the total number of citations for the 4340 to 471 (23.52%) of citations occurring in the year 2013-13 and 86 (1.98%) in the year 2020. The shows 4 other sources account for 1619 of the citations in their theses (36.86%). Journals get the highest number of citations used by researchers in industrial engineering accounting (41.88%) 1818, followed by conferences with (11.03%) 479, books with (3.73%) 162, theses (2.2860%) 99, and theses with the least number of citations used by researchers (1.61%) 70 (Figure 5) [6].
| Book | Confer | Journal | Link | Maga | Symp | Trans | Thesis | others | Citation | |
|---|---|---|---|---|---|---|---|---|---|---|
| 2014-14 | -- | 6 | 21 | -- | -- | 1 | 1 | 1 | 30 | 60 |
| 2015-15 | 1 | 3 | 15 | -- | -- | -- | 6 | 1 | 26 | 52 |
| 2016-16 | -- | 3 | 11 | 4 | -- | -- | -- | 3 | 21 | 42 |
| 2017-17 | 2 | 8 | 12 | -- | -- | 1 | 6 | -- | 29 | 58 |
| Total | 3 | 20 | 59 | 4 | 0 | 2 | 13 | 5 | 106 | 212 |
Table 4: Energy engineering.
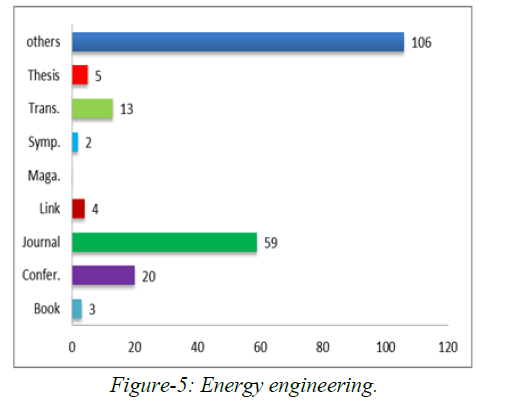
Figure 5: Energy engineering.
Figure 5 shows the total number of citations for the 212 to 30 (28.30%) of citations occurring in the year 2014-14 and 21 (19.81%) in the year 2016 to 16. Journals get the highest citations by authors in energy engineering accounting (27.83%). 59, then others (50%) 106 conference with (9.43%) 20, transaction (6.13%) 13 and thesis (2.35%) 05 link (1.88%) 4 books with (1.41%) 3 symposium (0.94%) with the fewest number of citations made by researchers 02 [7].
Pattern of authorship
It helps to know the most productive contribution to the subject. For this purpose, the information about all the authors was retrieved, arranged, and tabulated in order to find the type of authorship. Any subject characteristics include not only the basic publishing pattern but also the authors themselves (Table 5).
| Year | Authors | Two author | Three author | More than three | Cum. citation | Age% | Citation | Age% |
|---|---|---|---|---|---|---|---|---|
| 2011-11 | 14 | 41 | 23 | 11 | 89 | 20.89 | 89 | 20.89 |
| 2012-12 | 4 | 38 | 4 | -- | 46 | 10.79 | 135 | 31.68 |
| 2013-13 | 3 | 44 | 4 | 2 | 53 | 12.44 | 188 | 44.12 |
| 2014-14 | 10 | 48 | 7 | 3 | 68 | 15.96 | 256 | 60.08 |
| 2015-15 | 4 | 31 | 6 | 4 | 45 | 10.56 | 301 | 70.64 |
| 2016-16 | 2 | 20 | 2 | 4 | 28 | 6.57 | 329 | 77.21 |
| 2017-17 | 4 | 38 | 5 | 2 | 49 | 11.5 | 378 | 88.71 |
| 2018-18 | -- | -- | -- | -- | -- | -- | -- | -- |
| 2019-19 | 4 | 20 | 3 | 6 | 33 | 7.74 | 411 | 96.45 |
| 2020-20 | 1 | 10 | -- | 4 | 15 | 3.52% | 426 | 99.97 |
| Total | 46 | 297 | 84 | 41 | 426 | 99.97% | 99.97% |
Table 5: Year wise distribution of authors.
As shown in Table 6, books (89%) are the most often cited type of reference material in production engineering. This finding is in line with past citation analysis studies in engineering in general and its sub-disciplines. The other sources account for 68 (15.96%) of the thesis' citations (Figure 6).
| S. No | Faculty guide | Energy | Age% | Cumulative | Age% | Production | Age% | Cumulative | Age% |
|---|---|---|---|---|---|---|---|---|---|
| 1 | Rupinder Singh | -- | -- | -- | -- | 81 | 23.61 | 81 | 23.61 |
| 2 | Jasmaninder S. Grewal | -- | -- | -- | -- | 70 | 20.4 | 151 | 44.01 |
| 3 | Sehijpal Singh | -- | -- | -- | -- | 65 | 18.95 | 216 | 62.96 |
| 4 | J. Kapoor | -- | -- | 30 | 8.74 | 246 | 71.7 | ||
| 5 | Gurinder S. Brar | -- | -- | -- | -- | 20 | 5.83 | 266 | 77.53 |
| 6 | Gurmeet Kaur | -- | -- | -- | -- | 15 | 4.37 | 281 | 81.9 |
| 7 | Harwinder Singh | -- | -- | -- | -- | 12 | 3.49 | 293 | 85.39 |
| 8 | P. S. Bigla | 1 | 20 | 1 | 20 | 8 | 2.33 | 301 | 87.72 |
| 9 | Aprinder S. Sandhu | -- | -- | -- | -- | 5 | 1.45 | 306 | 89.17 |
| 10 | Harpuneet Singh | -- | -- | -- | -- | 4 | 1.16 | 310 | 90.33 |
| 11 | Chandandeep S. Grewal | -- | -- | -- | -- | 4 | 1.16 | 314 | 91.49 |
| 12 | Balraj S. Gill | -- | -- | -- | -- | 3 | 0.87 | 317 | 92.36 |
| 13 | Sudhir Gbai | -- | -- | -- | -- | 3 | 0.87 | 320 | 93.23 |
| 14 | Parminder Singh | -- | -- | -- | -- | 3 | 0.87 | 323 | 94.1 |
| 15 | Harnam S. Faraha | -- | -- | -- | -- | 2 | 0.58 | 325 | 94.68 |
| 16 | Jagdeep Singh | -- | -- | -- | -- | 2 | 0.58 | 327 | 95.26 |
| 17 | Prem Singh | 3 | 60 | 4 | 60 | 2 | 0.58 | 329 | 95.84 |
| 18 | K. K. Sareen | -- | -- | -- | -- | 2 | 0.58 | 331 | 96.42 |
| 19 | Amrinder S. Pannu | -- | -- | -- | -- | 2 | 0.58 | 333 | 97 |
| 20 | Harmeet Singh | 1 | 20 | 5 | 20 | 1 | 0.29 | 334 | 97.29 |
| 21 | Buta S. Sindh | -- | -- | -- | 1 | 0.29 | 335 | 97.58 | |
| 22 | Chantwant S. Panther | -- | -- | -- | 1 | 0.29 | 336 | 97.87 | |
| 23 | Gulvir Singh | -- | -- | -- | 1 | 0.29 | 337 | 98.16 | |
| 24 | Iqbal Sharma | -- | -- | -- | 1 | 0.29 | 338 | 98.45 | |
| 25 | Harpreet Kaur | -- | -- | -- | 1 | 0.29 | 339 | 98.74 | |
| 26 | Simranjit Singh | -- | -- | -- | 1 | 0.29 | 340 | 99.03 | |
| 27 | Suhkinderper Singh | -- | -- | -- | 1 | 0.29 | 341 | 99.32 | |
| 28 | Gaurav Goel | -- | -- | -- | 1 | 0.29 | 342 | 99.61 | |
| 29 | Jarwinder Singh | -- | -- | -- | 1 | 0.29 | 342 | 99.9 | |
| 31 | Total | 5 | 100 | 343 | 99.57% |
Table 6: Guide of faculty.
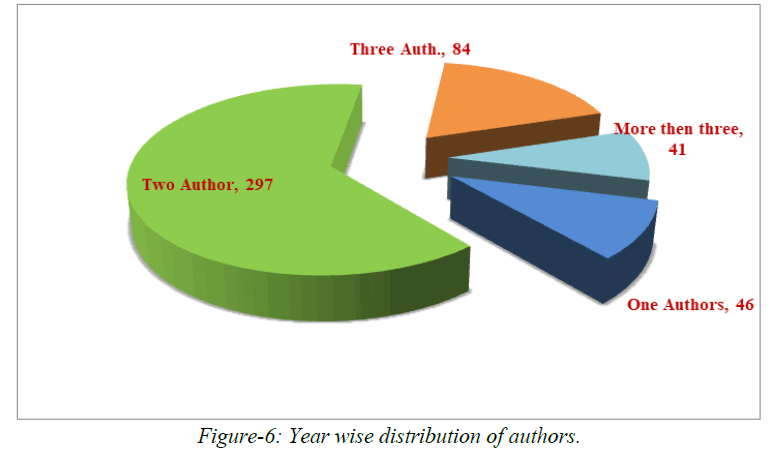
Figure 6: Year wise distribution of authors.
According to the above table, 297 out of 426 (6.11%) used single author books, while 41 out of 426 (6.11%) used citations from fourth author books. In this study, only book authorship patterns were used. The authorship pattern in this study indicates that mechanical engineering favoured single authors work (Table 7) [8].
| S. No | Faculty guide | Production | Age% |
|---|---|---|---|
| 1 | Rupinder Singh | 81 | 23.61 |
| 2 | Jasmaninder S. Grewal | 70 | 20.4 |
| 3 | Sehijpal Singh | 65 | 18.95 |
| 4 | J. Kapoor | 30 | 8.74 |
Table 7: Production first.
Rupinder Singh got top place in the above table with 81 successful candidates, followed by Jasmaninder S. Grewal with 70, Sehijpal Singh with 65, and J. Kapoor with 30. Rupinder Singh, who in top spot in GNDEC, is also vying for third spot in the nation wide ranking. In table 6 above, Rupinder Singh generated the most successful research, with 81 (23.68%), followed by Jasmaninder S. Grewal with 70 (20.46%), Sehijpal Singh with 65 (19%), J. Kapoor with 30 (8.77%), Gurinder S. Brar with 20 (5.84%), and Gurmeet Kaur with 15 (4.38%). During 2020, 271 research subjects successfully completed in 62 research guides. Prem Singh got the first 03 (60.00) in the table above. The by P.S. Bigla and Harmeet Singh with 01 (20.00) (Figure 7 and Tables 8 and 9).
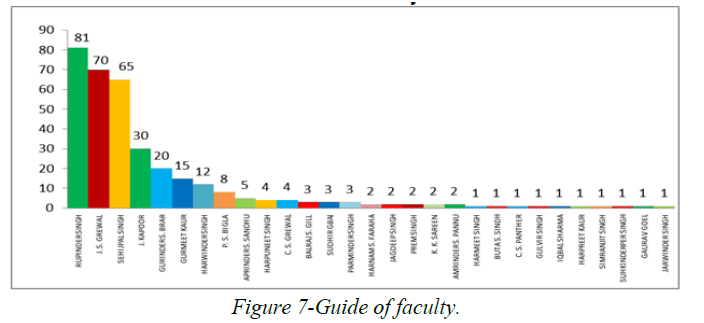
Figure 7: Guide of faculty.
| S.No | Faculty | Industrial | Age% | Citation | Age% |
|---|---|---|---|---|---|
| 1 | Harwinder Singh | 37 | 21.89 | 169 | 21.89 |
| 2 | Deepinder Singh | 34 | 20.11 | 203 | 42 |
| 3 | Gurinder S. Brar | 26 | 15.38 | 229 | 57.38 |
| 4 | Jagdeep Singh | 15 | 8.87 | 244 | 66.25 |
| 5 | Aprinder S. Sandhu | 13 | 7.69 | 257 | 73.94 |
| 6 | Harmeet Singh | 10 | 5.91 | 267 | 79.85 |
| 7 | P. S. Bigla | 10 | 5.91 | 277 | 85.76 |
| 8 | Harpuneet Singh | 7 | 4.14 | 284 | 89.9 |
| 9 | Sehijpal Singh | 5 | 2.95 | 289 | 92.85 |
| 10 | Prem Singh | 3 | 1.77 | 292 | 94.62 |
| 11 | J. Kapoor | 2 | 1.18 | 294 | 95.8 |
| 12 | Ravi I. Singh | 2 | 1.18 | 296 | 96.98 |
| 13 | Jasmaninder S. Grewal | 1 | 0.59 | 297 | 97.57 |
| 14 | Rupinder Singh | 1 | 0.59 | 298 | 98.16 |
| 15 | Chandandeep S. Grewal | 1 | 0.59 | 299 | 98.75 |
| 16 | Jatinder pal | 1 | 0.59 | 300 | 99.34 |
| 17 | Suhkinderper Singh | 1 | 0.59 | 301 | 99.93 |
| Total | 169 | 99.93 | 99.93% |
Table 8: Guide of Faculty.
| S.No | Faculty guide | Industrial | Age% |
|---|---|---|---|
| 1 | Harwinder Singh | 37 | 21.89 |
| 2 | Deepinder Singh | 34 | 20.11 |
| 3 | Gurinder Singh | 26 | 15.38 |
| 4 | Jagdeep Singh | 15 | 8.87 |
| 5 | Aprinder S. Sandhu | 13 | 7.69 |
| 6 | Harmeet Singh | 10 | 5.91 |
| 7 | P. S. Bigla | 10 | 5.91 |
Table 9: Industrial first.
Table 10 gives form wise distribution of citation analyses and has shown that 5069 (44.07%) citations out of total 11502 citations are journals. A rank list is prepared on the basis of the frequency of citations used. It is followed by the year 2011-2020 which received Deepinder Singh (20.11%) 34, Gurinder S. Brar (15.38%) 26, Jagdeep Singh (8.87%) 15, Aprinder S. Sandhu (7.69%) 13, P. S. Bigla and Harmeet (5.91%) both 10, Jasmaninder S. Grewal, Rupinder Singh, Chandandeep S. Grewal, Jatinder pal and Suhkinderpal Singh (0.59%) received. Harwinder Singh got first place in the above table with 37 successful candidates, followed by Deepinder Singh with 34 candidates [9]. Above table with 10 (5.91%) successful candidates, followed by Harmeet Singh and P.S. Bigla with candidates (Figures 8 and 9).
| S. No | Faculty | Energy | Age% | Cumulative | Age% |
|---|---|---|---|---|---|
| 1 | P. S. Bigla | 1 | 20 | 1 | 20 |
| 2 | Prem Singh | 3 | 60 | 4 | 80 |
| 3 | Harmeet Singh | 1 | 20 | 5 | 20 |
| Total | 5 | 100% | 100% |
Table 10: Guide of faculty.
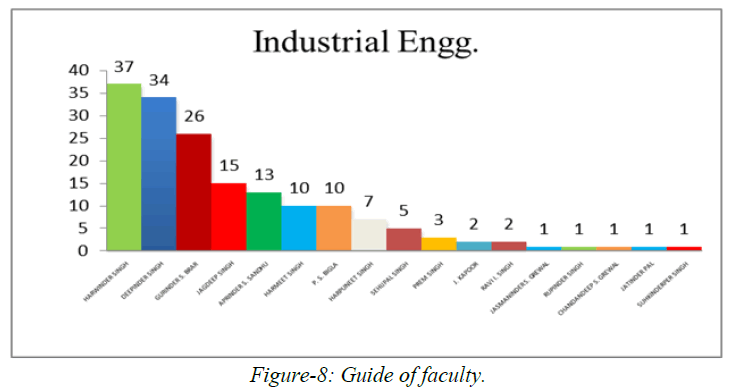
Figure 8: Guide of faculty.
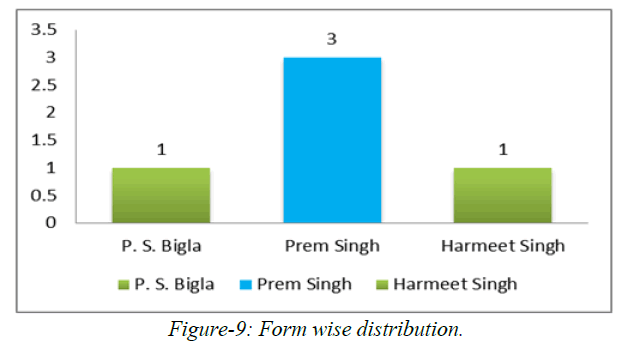
Figure 9: Form wise distribution.
According to the graph, the total number of citations was 5 (100%) in 2014-14 and 86 (1.98%) in 2020. It is followed by the years 2014-2017, which received P. S. Singh (1.0%), Harmeet Singh 1 (1.0%), and Prem Singh 3 (60.00%) for the most successfully generated research [10].
Conclusion
To better understand the information sources used by the M. Tech citation analysis of these students at the GNDEC this study used citation analysis. Citations in the fields of energy, industrial, and production engineering were studied from 2011-2020 with an average of 11502 (99.97%) citations. A study shows that the highest number of citations (41.88) occurred in the years 2011-2023. The lowest number of citations was 25 (0.21%) in the year 2020. According to one study, the highest number of citations (41.88%) 1818 occurred between 2011-2020. The lowest number of citations was in magazine and Ph.D. 08 (0.18%) in the year 2020. According to one study, the highest number of citations 03 (60.00%) occurred from 2014-2017. The other sources most preferred were periodicals and journals. The shows that the total number of citations for the 212 to 30 (28.30%) of citations occurring in the year 2014-14 and 21 (19.81%) in the year 2016-16. Suggestions for future research might include analyzing M. Tech Theses to develop improved information skills you.
References
- Yeap, C. K., and Kiran, K. "Citation study of library and information science dissertations for collection development." Malaysian Journal of Library and Information Science 13.2 (2008): 29-47.
- Manpreet, S. Information resource in electronics and communication Engineering and VLSI: Citation analysis materials used by engineering theses students, GNDEC. 10.5 (2022): 210-218.
- Singh, K. P., and Bebi, M. "Citation analysis of PhD theses in sociology submitted to university of Delhi during 1995-2010." Journal of Library and Information Technology 33.6 (2013). 489-489.
- Kumar, K., and Reddy, T. R. Citation analysis of dissertations submitted to the department of LIS, SV university, Tirupati. 2.2 (2012): 44-58.
- Anaehobi, E. S. and Muokebe, B. Citation analysis of theses in the departments of engineering and technology, N. Azikiwe university, Nigeria, JAIT. 7.2 (2014): 2014.
- Dhiman, G., and Vijay, K. "Seagull optimization algorithm: Theory and its applications for large-scale industrial engineering problems." Knowledge-based Systems 165 (2019): 169-196.
- Koksal, G., and Edi̇tman, A. "Planning and design of industrial engineering education quality." Computers and Industrial Engineering35.3-4 (1998): 639-642.
- Cancino, C., et al. "Forty years of computers and industrial engineering: A bibliometric analysis." Computers and Industrial Engineering113 (2017): 614-629.
- Jiménez, M, et al. "5S methodology implementation in the laboratories of an industrial engineering university school." Safety science 78 (2015): 163-172.
- Toto, R., and Nguyen, H. "Flipping the work design in an industrial engineering course." 18-21 October 2009, 39th IEEE frontiers in education conference. San Antonio, TX, USA. 2009.
Author Info
Manpreet Singh* and Rajinder SharmaReceived: 24-May-2023, Manuscript No. IJLIS-23-99804; Editor assigned: 26-May-2023, Pre QC No. IJLIS-23-99804 (PQ); Reviewed: 09-Jun-2023, QC No. IJLIS-23-99804; Revised: 24-Jul-2023, Manuscript No. IJLIS-23-99804 (R); Published: 16-Aug-2025, DOI: 10.35248/2231-4911.23.13.853
Copyright: This is an open access article distributed under the terms of the Creative Commons Attribution License, which permits unrestricted use, distribution, and reproduction in any medium, provided the original work is properly cited.
Call for Papers
Authors can contribute papers on
What is Your ORCID
Register for the persistent digital identifier that distinguishes you from every other researcher.
Social Bookmarking
Know Your Citation Style
American Psychological Association (APA)
Modern Language Association (MLA)
American Anthropological Association (AAA)
Society for American Archaeology
American Antiquity Citation Style
American Medical Association (AMA)
American Political Science Association(APSA)


