Research Article - (2025) Volume 14, Issue 1
Assessment of Digital Literacy Skills of the POST Graduate Students of Bangalore North University, Kolar, Karnataka, India: A Study
Sharadamma CA1* and Hemavathi BN2Abstract
Higher education institutions are responsible for preparing their student's incompetent workforce. Information and Communication Technologies (ICT) play a vital role in impacting digital literacy skills. A study of the digital literacy skills of 186 postgraduate students registered for the first year in Bangalore North University, PG center, Kolar during 2021-22. The questionnaire was used as the data collection tool. The findings reveal that most of the respondents use ICT tools for social media. 62.90% of them have smart phones and 94 (50.53%) of the respondents use the internet minimum of two hours/day. This study found that respondents use the most minor internet for study purposes and high usage for entertainment. The majority of the respondents use search strategies to save their time. It was found from the study that 62 (33.33%) of the respondents were willing to switch over from conventional classroom learning to digital learning platforms.
References
Stone Market in Ohio Stone Market in North Carolina Stone Market in Orlando Stone Market in Tampa Stone Market in AtlantaKeywords
Digital literacy, Digital literacy skills, Bangalore North University, Post graduate students.
Introduction
As digital technology has become more common, reasonable, and convenient, people from all parts of the world are starting to increase their online and digital involvement. With the advent of ICT society has changed in every aspect of their life, as a result lots of changes have taken place in the different ways of performing task. Today technology changes faster than society, that’s why everyone must know the right skills to perform their duties. So digital literacy skills is very important to acquire in the digital environment. Digital literacy is playing a vital role in e-learning [1]. Because today each and every information is available in finger tips with the wide availability and access of past internet. Even much learning or education material can accessible through databases, websites, Learning Management Systems (LMS), web portals etc. Therefore digital literacy skills are very important for students to succeed in the new millennium of education. Digital literacy skills are obviously becoming the survival skills to overcome the present situation of information age with the rapid development of new technologies like computers, smart phones etc.
Digital literacy includes a variety of "new" technologies. Without adequate digital literacy skills an individual can feel like distinguished in the society. Therefore, it is very important for the future of students to acquire the skills to find, evaluate, communicate and share online content effectively and responsibly [2]. Like information literacy, digital literacy requires skills in locating and using information as well as critical thinking. However, beyond that, digital literacy involves understanding digital tools and using them in a communicative and collaborative manner through social engagement. Paul Gilster in the seminal book describes digital literacy as “the ability to understand and use information in multiple formats from a wide range of sources when it is presented via a computer”. The American Library Association (ALA) defines digital literacy as “the ability to use information and communication technologies to find, evaluate, create, and communicate information, requiring both cognitive and technical skills.”
In the present study, digital literacy skills required for post graduate students to survive in the digital environment to succeed in their academics. Therefore, digital adoption is urgent in all services and businesses, including education.
Bangalore North University
Bangalore North University is a state university located in Kolar, near NH75, Karnataka, India. The university was recognized in 2017 by government of Karnataka through the Karnataka State Universities (Amendment) Act, 2015. Bangalore North University affiliating all colleges under Srinivaspur, Mulbagal, KGF, Bangarpet, Kolar and Malur assembly constituencies in Kolar district; KR Puram, Pulikeshinagar, Sarvagnanagar, CV Raman Nagar and Mahadevapura assembly constituencies in Bengaluru Urban district; Devanahalli, Doddaballapur and Hoskote assembly constituencies in Bengaluru Rural district; Gauribidanur, Bagepalli, Chikkaballapur, Sidlaghatta and Chintamani assembly constituencies in Chikkaballapur district;. The university was operated from academic year 2017-18 from temporary offices in the campus of Karnataka State Open University at Tamaka, on the outskirts of Kolar. A permanent campus will be constructed at Amaravathi village in Chickballapur district, Karnataka.
Need for the study
In the contemporary information society, the digital literacy skills are required for various purposes. In present scenario education systems have been changed and it’s very important to understanding of how to use digital devices to survive in their academics and also communication has been grown up in a faster way [3]. Thus how to search in internet to find required information, how to communicate electronically and to manage data. Thus, students need to possess effective skills to develop new ways to interact with the sources of information available through the use of technologies. With the understanding of digital technology as a basis for a lifelong learning.
Digital literacy has positive effects on student’s successful learning. Hence, the present study is to assess the Digital literacy skills of postgraduate students of Bangalore North University, Kolar, Karnataka, India.
Objectives of the study
The main objectives of study were:
•To identify the purpose of using the ICT utensils by respondents.
•To discover the reason of using the internet by the respondents.
•To find the Information search strategies adopted by the respondents and purpose ofusing
•To know the Awareness of Consortiums and Databases by the respondents
•To recognize the awareness of open Education Resources (OER).
•To know the respondents opinion to prefer online teaching platforms.
Scope of the study
The scope of the study is restricted to post graduate students of Bangalore North University Library. The present study is limited to the digital literacy skills of post graduate students (2021-22 joining) of Bangalore North University and covered all the post graduate department students like arts stream, science stream and commerce stream.
Research methodology
The total intake offered by various departments of Bangalore North University, Kolar, Karnataka, India is 427 for the academic year 2021-22. A simple random sampling technique was used to derive the sample size in correlation with Krejcie and Morgan table [4]. Around 214 questionnaires were distributed among the post graduate students i.e. 50% of the total target population. Among 214 respondents, 186 have responded with a response rate of 86.91%.
Literature Review
Buckingham defines in his research article about digital literacy and need of digital media for young people. This article gives a purpose for the belief of digital literacy in education. Pointing to a number of the constraints on this field. Parvathamma and Pattar conducted a survey among student community at management institutions. The objective of the study is to find ICT tools used and purpose of using them. It also aims to get opinion of students regarding web based and software services [5]. Krishnamurthy and Shettappanavar defined literacy of digital resources used by female post graduate students. The study also determines students' ICT proficiency levels, and how often students use the Internet. Respondents check their knowledge and familiarity of different databases and Search strategy to get E-resources. Kateryna, et al. gives an outline of digital literacy development trends for professional environment. This article describes the effect of digital literacy at the expert environment, which permits humans to create and proportion digital content. Rinekso, et al. has investigated in their article, the digital literacy practices in tertiary education: A case of english as a foreign language postgraduate students. This study intensively discusses the styles of digital equipment utilized by the members and the functions of using them [6]. Digital literacy is an essential prerequisite for all people in the ongoing information evolution in digital culture which furnishes people with the skills that will help in making use of the digital technology in all spheres of life (Table 1).
| Sl. No | Course | Department | Approved intake | Payment seats | Total |
|---|---|---|---|---|---|
| 1 | MA Economics | Department of Economics, P.G. Centre, Kolar | 36 | 10 | 46 |
| 2 | MA English | Department of English, P.G. Centre, Kolar | 20 | 6 | 26 |
| 3 | Masters in Social Work (MSW) | Department of Social Work, P.G. Centre, Kolar | 32 | 10 | 42 |
| 4 | MA Journalism & Mass Communication | Department of Journalism and Mass Communication, P.G.Centre, Kolar | 20 | 4 | 24 |
| 5 | MA Kannada | Department of Kannada Studies, P.G. Centre, Kolar | 46 | 5 | 51 |
| 6 | MA political Science | Department of Political Science, P.G. Centre, Kolar | 30 | 4 | 34 |
| 7 | MSc Botany | Department of Botany, P.G. Centre, Kolar | 20 | 4 | 24 |
| 8 | MSc Computer Science | Department of Computer Science, P.G. Centre, Kolar | 20 | 4 | 24 |
| 9 | Masters in Library and Information Science | Department of Library and Information Science, P.G. Centre, Kolar | 20 | 4 | 24 |
| 10 | MSc Mathematics | Department of Mathematics, P.G. Centre, Kolar | 30 | 8 | 38 |
| 11 | MSc Physics | Department of Physics, P.G. Centre, Kolar | 30 | 8 | 38 |
| 12 | M.Com | Department of Commerce, P.G. Centre, Kolar | 46 | 10 | 56 |
| Total number of students | 427 | ||||
Table 1: Population of the study (Bangalore North University post graduate courses and intake offered by various departments for academic year 2021-22)
Data analysis
The data collected from the respondents through questionnaires was analyzed using simple percentage technique and presented in a tabular form [7]. The results of the analysis are presented in the following sections.
Table 2 indicates that 120 questionnaires distributed to male respondents with response rate of 109 (90.83%). 94 questionnaires were circulated among female respondents with the response rate of male respondents.
| Gender | Distribution | Responded | Percentage (%) |
|---|---|---|---|
| Male | 120 | 109 | 90.83% |
| Female | 94 | 77 | 81.91% |
Table 2: Gender wise distribution of respondents
Table 3 indicates the response rate of arts students is 88 (82.24%); response rate of science students is 59 (92.18%), whereas response rate of commerce stream is 39 (90.69%).
| Stream | Distribution | Responded | Percentage (%) |
|---|---|---|---|
| Arts | 107 | 88 | 82.24% |
| Science | 64 | 59 | 92.18% |
| Commerce | 43 | 39 | 90.69% |
Table 3: Stream wise distribution of questionnaires
Table 4 indicates the purpose of utilizing the ICT tolls, it is observed that majority of the respondents 113 (60.75%) are using ICT tools to engage in the social media, followed by personal work 86 (46.23%), browsing internet 99 (53.22%) and access of E-resources 68 (36.55%) and the least being study purpose 57 (30.64%) (Figure 1).
| Purpose of using ICT Tool | No. of respondents | Percentage (%) |
|---|---|---|
| Study purpose | 57 | 30.64% |
| Personal work | 86 | 46.23% |
| Browsing Internet | 99 | 53.22% |
| Access of E-resources | 68 | 36.55% |
| Social media | 113 | 60.75% |
Table 4: Purpose of using ICT utensils by the respondents

Figure 1: Purpose of using ICT tools
Analysis shows that more than 60% of the respondents own their smart phone (Table 5). Among them, 76 respondents (40.86%) possess laptops, 58 respondents (31.18%) possess desktop and the remaining 38 (20.43%) they have notebook and 82 (44.08%) have their own tablet [8]. Hundred and seventeen respondents (62.90%) have their own smart phone to connect to internet (Figure 2).
| Type of ICT tools | No. of respondents | Percentage (%) |
|---|---|---|
| Laptop | 76 | 40.86% |
| Desktop | 58 | 31.18% |
| Notebook | 38 | 20.43% |
| Smart Phone | 117 | 62.90% |
| Tablet | 82 | 44.08% |
Table 5: Type of ICT tools preferred by the respondents

Figure 2: Type of ICT tools used by the respondents
Respondents were asked to purpose of using internet, Table 6 reveals that 86 (46.23%) are of the opinion that they are using internet for entertainment, followed by to retrieve web based information 63 (33.87%), to know the current affaires 52 (27.95%) and 48 (25.80%) opined that using ICT for their project work (Figure 3).
| Reason of using internet | No. of respondents | Percentage (%) |
|---|---|---|
| For entertainment | 86 | 46.23% |
| To retrieve web based information | 63 | 33.87% |
| For project work | 48 | 25.80% |
| To know the current affaires | 52 | 27.95% |
Table 6: Reason of using the internet by the respondents

Figure 3: Reason of using internet
Table 7 shows the time spent on internet by the respondents. The results of the table indicate that, majority of the respondents i.e. 94 (50.53%) have used the internet 2 hours/day [9]. Least of the respondents i.e. 12 (6.45%) will use the internet more than 5 hour/day, followed by 40 (21.5%) use less than 30 min/day, 63 (33.87%) use internet 30 min/day, 76 (40.86%) they use daily 1 hour, 48 (25.8%) use more than two hours per day. The table clearly indicates that majority of the respondents use the internet based on their requirements (Figure 4).
| Time spent on Internet | No. of respondents | Percentage (%) |
|---|---|---|
| less than 30 min/day | 40 | 21.50% |
| 30 min/day | 63 | 33.87% |
| 1 hour/day | 76 | 40.86% |
| 2 hour/day | 94 | 50.53% |
| more than 2 hour/day | 48 | 25.80% |
| more than 5 hour/day | 12 | 6.45% |
Table 7: Time spent on internet by the respondents

Figure 4: Time spent on internet
Respondents were asked about information search strategies adopted and purpose of using based on the features mentioned in the below Table 8 indicates that the majority of the respondents 55 (29.56%) are using basic search to save their time and 36 (19.35%) are using to get the exact data. Further, the majority of the respondents i.e. 63 (33.87%) are good in phrase search and least no. of respondents i.e. 30 (16.12%) are fair in using to filter the information [10]. Followed by 54 (29.03%) respondents opines that they are excellent in using Boolean logic while 59 (31.72%) respondents stated that they are excellent in using Advanced searching with majority of the respondents 61 (32.79%) felt truncated search is ultimate to filter the information from the internet.
The Table clearly indicates that majority of the respondents using search strategies to save their time.
| Search Strategies/purpose of using | To save the time | Faster access of information | To get the exact information | To filter from the vast |
|---|---|---|---|---|
| Basic search | 55 (-29.56%) | 43 (23.11%) | 36 (19.35%) | 52 (27.95%) |
| Phrase searching | 63 (33.87%) | 41 (22.04%) | 52 (27.95%) | 30 (16.12%) |
| Boolean logic | 48 (25.80%) | 39 (20.96%) | 45 (24.19%) | 54 (29.03%) |
| Advanced searching | 59 (31.72%) | 44 (23.65%) | 46 (24.73%) | 37 (19.89%) |
| Truncated search | 36 (19.35%) | 46 (24.73%) | 43 (23.11%) | 61 (32.79%) |
Table 8: Information search strategies adopted by the respondents and purpose of using
Table 9 reveals that majority of the respondents 86 (46.23%) preferred to use N-list followed by UGC-Infonet 62 (33.33%), INDEST 28 (15.05), e-Shodhasindu 34 (18.27%), 46 (24.73%) opined that they use web of science, 42 (22.58%) of the respondents expressed to use Scopus and 32 (17.20%) of the respondents are aware of EBSCO and the participants are least aware 27 (14.51%) of JSTOR [11].
| Awareness of databases | No. of respondents | Percentage (%) |
|---|---|---|
| N-list | 86 | 46.23 |
| UGC-infonet | 62 | 33.33 |
| INDEST | 28 | 15.05 |
| e-Shodhasindu | 34 | 18.27 |
| Web of science | 46 | 24.73 |
| Scopus | 42 | 22.58 |
| EBSCO | 32 | 17.2 |
| JSTOR | 27 | 14.51 |
Table 9: Awareness of consortiums and databases by the respondents
Table 10 shows the frequency of databases and consortium usage by the respondents. The results of the table indicate that, highest 49 (26.34%) have used the N-list daily and least i.e. 31 (16.66%) respondents use e-Shodhasindu daily. Further weekly JSTOR 47(25.26%) is the highest and scopus is lowest usage i.e. 34 (18.27%). In monthly usage of databases INDEST got highest usage i.e. 48 (25.80%) and N-list is 29 (15.59%) as lowest. Sometime respondents use more JSTOR i.e. 60 (32.25%) and least usage as 39 (20.96%). In below Table 11 (5.91%) never use N-list followed by UGC-Infonet 23 (12.36%), INDEST 13 (6.98%), e-shodhasindu 33(17.74%) and so on. A below Table clearly indicate that still some percentage of respondents never use databases and consortium in any time.
| Frequency of databases and consortium usage | Daily | Weekly | Monthly | Sometime | Never |
|---|---|---|---|---|---|
| N-list | 49 (26.34%) | 39 (20.96%) | 29 (15.59%) | 58 (31.18%) | 11 (5.91%) |
| UGC-infonet | 38 (20.43%) | 41 (22.04%) | 38 (20.43%) | 46 (24.73%) | 23 (12.36%) |
| INDEST | 34 (18.27%) | 36 (19.35%) | 48 (25.80%) | 55 (29.56%) | 13 (29.56%) |
| e-Shodhasindu | 31 (16.66) | 45 (24.19%) | 30 (16.12%) | 47 (25.26%) | 33 (25.26%) |
| Scopus | 43 (23.11%) | 34 (18.27%) | 44 (18.27%) | 39 (20.96%) | 25 (20.96%) |
| EBSCO | 37 (19.89%) | 35 (18.81%) | 45 (24.19%) | 55 (29.56%) | 14 (7.52%) |
| JSTOR | 30 (16.12%) | 47 (25.26%) | 39 (20.96%) | 60 (32.25%) | 10 (5.37%) |
Table 10: Frequency of databases and consortium used by the respondents
The Table 11 shows the awareness of Open Education Resources (OER) by the respondents. It is clearly observed from the table that, majority of the respondents 67 (36.02%) aware of OER commons and 56 (30.10%) respondents aware of academic earth followed by 47 (25.26%) learning pod. About 53 (28.49%) of the respondents prefer to use open learning initiative [12,13]. Around 63 (33.87%) respondents opined that they use Khan academy and with least number of respondents i.e. 39 (20.96%) respondents expressed they are aware of Merlot.
| Awareness of open education resources | No. of respondents | Percentage (%) |
|---|---|---|
| OER commons | 67 | 36.02% |
| Academic Earth | 56 | 30.10% |
| Learning pod | 47 | 25.26% |
| Open Learning Initiative | 53 | 28.49% |
| Merlot | 39 | 20.96% |
| Khan Academy | 63 | 33.87% |
Table 11: Awareness of open education resources (OER) by the respondents
It is observed from the below Table 12 that majority of the respondents 73 (38.70%) excellent that they make use of OER commons, 41 (22.04%) of the respondents very good they use academic earth, 54 (29.03%) of the respondents are ranked open learning initiative is very good to use followed by 44 (23.65%) respondents indicated Merlot is poor and 36 (19.35%) very poor [14].
| Open education resources/Ranking | Very poor | Poor | Good | Very good | Excellent |
|---|---|---|---|---|---|
| OER commons | 20 (10.75%) | 18 (9.67%) | 43 (23.11%) | 33 (17.74%) | 72 (38.70%) |
| Academic earth | 19 (10.25%) | 34 (18.27%) | 30 (16.12%) | 41 (22.04%) | 62 (33.33%) |
| Learning pod | 33 (17.74%) | 21 (11.29%) | 46 (24.73%) | 28 (15.05%) | 58 (31.18%) |
| Open learning initiative | 28 (15.05%) | 41 (22.04%) | 54 (29.03%) | 31 (16.66%) | 32 (17.20%) |
| Merlot | 36 (19.35%) | 44 (23.65%) | 32 (17.20%) | 36 (19.35%) | 38 (20.43%) |
| Khan academy | 23 (12.36%) | 20 (10.75%) | 42 (22.58%) | 35 (18.81%) | 66 (35.48%) |
Table 12: Ranking the quality of Open Education Resources (OER)
The question was raised to know the respondents willingness about switching over from conventional classroom learning to digital learning platforms [15]. From Table 13 out of 186 respondents, 62 (33.33%) of the respondents stated that they agreed to switching over from conventional classroom learning to digital learning platforms, 86 (46.23%) stated that they not agree to switching from offline class room learning to digital learning and 38 (20.43%) of the respondents stated that may be they will switching from conventional to digital mode of learning [16].
| Switching over from conventional classroom learning to digital learning platforms | No. of Respondents | Percentage% |
|---|---|---|
| Yes | 62 | -33.33% |
| No | 86 | -46.23% |
| Maybe | 38 | -20.43% |
Table 13: Switching over from conventional classroom learning to digital learning platforms?
Discussion and Findings
•The majority of the respondents i.e. 113 (60.75%) use the ICT tools for the purpose ofsocial media, followed by browsing the internet 99 (53.22%), Access of E-resources 68(36.55%), study purpose 57 (30.64%) and 86 (46.23%) least of the respondents theyuse it for study purpose.
•Among respondents 62.90% of the respondents own their smart phone. Least of therespondents i.e. only 38 (20.43%) they have notebook. It’s found that most of therespondents have used smart phone for their work.
•In the present study majority of the respondents i.e. 86 (46.23%) are opinioned they areusing internet for entertainment, followed by to retrieve web based information 63(33.87%), to know the current affaires 52 (27.95%) and least of the respondents i.e. 48(25.80%) opined that using ICT for their project work.
•The results of the present study reveal that 94 (50.53%) of the respondents use internet2hours/day. Least of the respondents i.e. 12 (6.45%) will use the internet more than 5hour/day. The findings are clearly indicates that majority of the respondents use the internet up to 2 hours per day based on their requirements.
•Majority of the respondents i.e. 63 (33.87%) are good in phrase search and using forsave their time and least no. of respondents i.e. 30 (16.12%) are fair in using searchstrategies to filter the information.
•Study reveals that majority of the respondents 86 (46.23%) preferred to use N-list andleast number of respondents i.e. 27 (14.51%) are only aware about JSTOR.
•In this study it’s clearly observed that majority i.e. 67 (36.02%) aware of OERcommons and 63 (33.87%) aware of Khan Academy. Respondents are least aware aboutMerlot i.e. 39 (20.96%).
•It was found from the study that, majority of the respondents i.e. 72 (38.70%) givenrating as excellent for OER commons and 66 (35.48%) have rated Khan Academy isexcellent.
•It was found from the study that, 62 (33.33%) respondents were willing and 86(46.23%) were not willing to Switching over from conventional classroom learning todigital learning platforms and remaining 38 (20.43%) were responded as may be theywill accept the change.
Suggestions
•The study reveals that awareness about open education resources still not up to thelevel among students. They need some awareness programs regarding openeducation resources.
•It is evident from the study that, the majority of the respondents use advancedsearching to save their time than other information search strategies. Since thesesearch strategies are important to improve their academic performance. Hence, thestudy suggests to the library authorities to make it possible by conducting trainingprograms and information literacy programs to the students to focus more onimproving search skills.
•The study reveals that most of them using ICT tools to engage in social media andless in study purpose. Since studying is important part of students life. Hence it isnecessity to advise them use ICT tools for the study purpose by the faculties.
Conclusion
In recent days students are competent in using ICT tools and digital literacy skills. By using the digital literacy skills, their ability of using web based services like email and other social media flat forms has been increased. At the same time use them for learning and study purpose is found to be minimal. Hence there is need to train the post graduate students and digital literacy skills outlined in the curriculum to use it for learning purpose. Then only they can utilize all the online information resources available on the web effectively to succeed in their academics.
References
- Tsige EH. Why digitally literate society is important for Ethiopia? 6.6 (2020): 7.
- Salim S, et al. “The use of digital literacy in higher education”. Al-Ishlah: Jurnal Pendidikan 12.1 (2020): 52–66.
[Crossref] [Googlescholar] [Indexed]
- Rinekso AB, Rodliyah RS and Pertiwi I. “Digital literacy practices in tertiary education: A case of EFL postgraduate students”. Studies in English Language and Education 8.2 (2021): 622–641.
[Crossref] [Googlescholar] [Indexed]
- Priwati AR and Helmi AF. “The manifestations of digital literacy in social media among Indonesian youth”. HUMANITAS: Indonesian Psychological Journal 18.1 (2021):14-23.
[Crossref] [Googlescholar] [Indexed]
- Park H, Kim HS and Park HW. “A Scientometric Study of Digital Literacy, ICT Literacy, Information Literacy, and Media Literacy”. Journal of Data and Information Science 6.0 (2020):116 – 138.
- Balakrishnan R and Ramalingam J. Digital Literacy Skills of the Aspirants of Competitive Examinations in the Anna Centenary Library, Chennai: A Study. Library Philosophy and Practice (e-journal) (2019): 1-17.
- Polizzi G. “Digital literacy and the national curriculum for England: Learning from how the experts engage with and evaluate online content”. Computers and Education 152 (2020):103859.
[Crossref] [Googlescholar] [Indexed]
- MacLure K and Stewart D. “Self-Reported Digital Literacy of the Pharmacy Workforce in North East Scotland”. Pharmacy 3.4 (2015):182–196.
[Crossref] [Googlescholar] [Indexed]
- Buckingham D. Defining Digital Literacy. In B. Bachmair (Ed.), Medienbildung in neuen Kulturräumen. VS Verlag fur Sozialwissenschaften. (2010): pp. 59–71.
- Mansour E. “A survey of digital information literacy (DIL) among academic library and information professionals”. Digital Library Perspectives 33.2 (2017):166–188.
- Krishnamurthy, C. and Latha Shettappanavar. “Digital literacy among Female Postgraduate students of Karnatak University, Dharwad, Karnataka, India: A study.” (2019).
- Warno K. “The factors influencing digital literacy of vocational high school teachers in Yogyakarta”. Journal of Physics: Conference Series 1446.1 (2020):012068.
[Crossref] [Googlescholar] [Indexed]
- Matthews B. “Digital Literacy in UK Health Education: What Can Be Learnt from International Research?” Contemporary Educational Technology 13. 4 (2021):ep317.
[Crossref] [Googlescholar] [Indexed]
- Kumpulainen K, Sairanen H and Nordstrom A. “Young children’s digital literacy practices in the sociocultural contexts of their homes”. Journal of Early Childhood Literacy 20. 3 (2020):472–499.
[Crossref] [Googlescholar] [Indexed]
- Kateryna A, et al. “Digital Literacy Development Trends in the Professional Environment”. International Journal of Learning, Teaching and Educational Research 19. 7 (2020):55–79.
[Crossref] [Googlescholar] [Indexed]
- Parvathamma N, Pattar D. “Digital literacy among student community in management institutes in Davanagere District, Karnataka State, India”. Annals of Library and Information Studies (ALIS), 60. 3 (2013):159-166.
[Crossref] [Googlescholar] [Indexed]
Author Info
Sharadamma CA1* and Hemavathi BN22Department of Studies and Research in Library and Information Science, Tumkur University Tumkur, Karnataka, India
Received: 19-Sep-2022, Manuscript No. IJLIS-22-75156; Editor assigned: 22-Sep-2022, Pre QC No. IJLIS-22-75156 (PQ); Reviewed: 06-Oct-2022, QC No. IJLIS-22-75156; Revised: 23-Dec-2022, Manuscript No. IJLIS-22-75156 (R); Published: 16-Aug-2025, DOI: 10.35248/2231-4911.23.13.842
Copyright: This is an open access article distributed under the terms of the Creative Commons Attribution License, which permits unrestricted use, distribution, and reproduction in any medium, provided the original work is properly cited.
Call for Papers
Authors can contribute papers on
What is Your ORCID
Register for the persistent digital identifier that distinguishes you from every other researcher.
Social Bookmarking
Know Your Citation Style
American Psychological Association (APA)
Modern Language Association (MLA)
American Anthropological Association (AAA)
Society for American Archaeology
American Antiquity Citation Style
American Medical Association (AMA)
American Political Science Association(APSA)

Google Scholar citation report
Citations : 1680
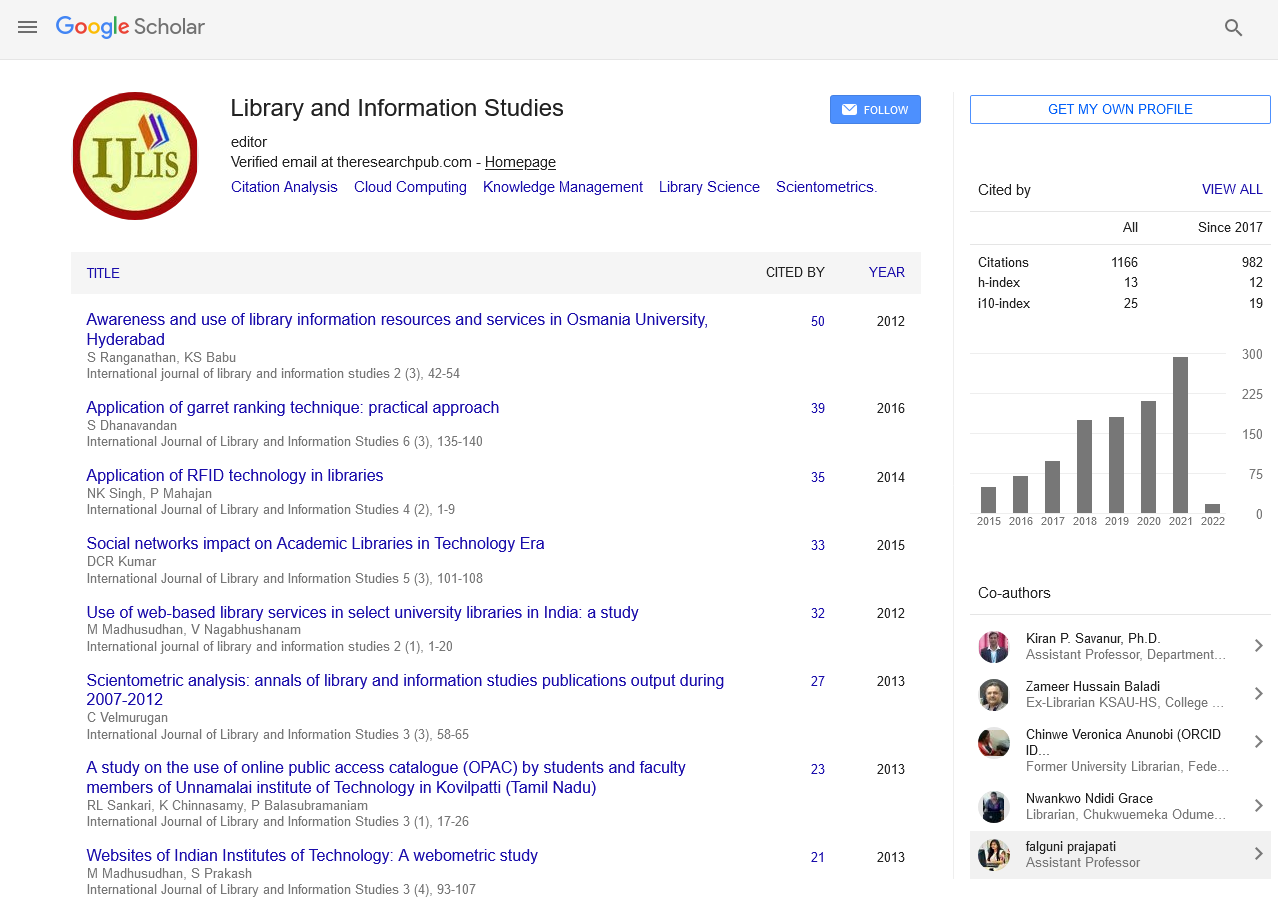
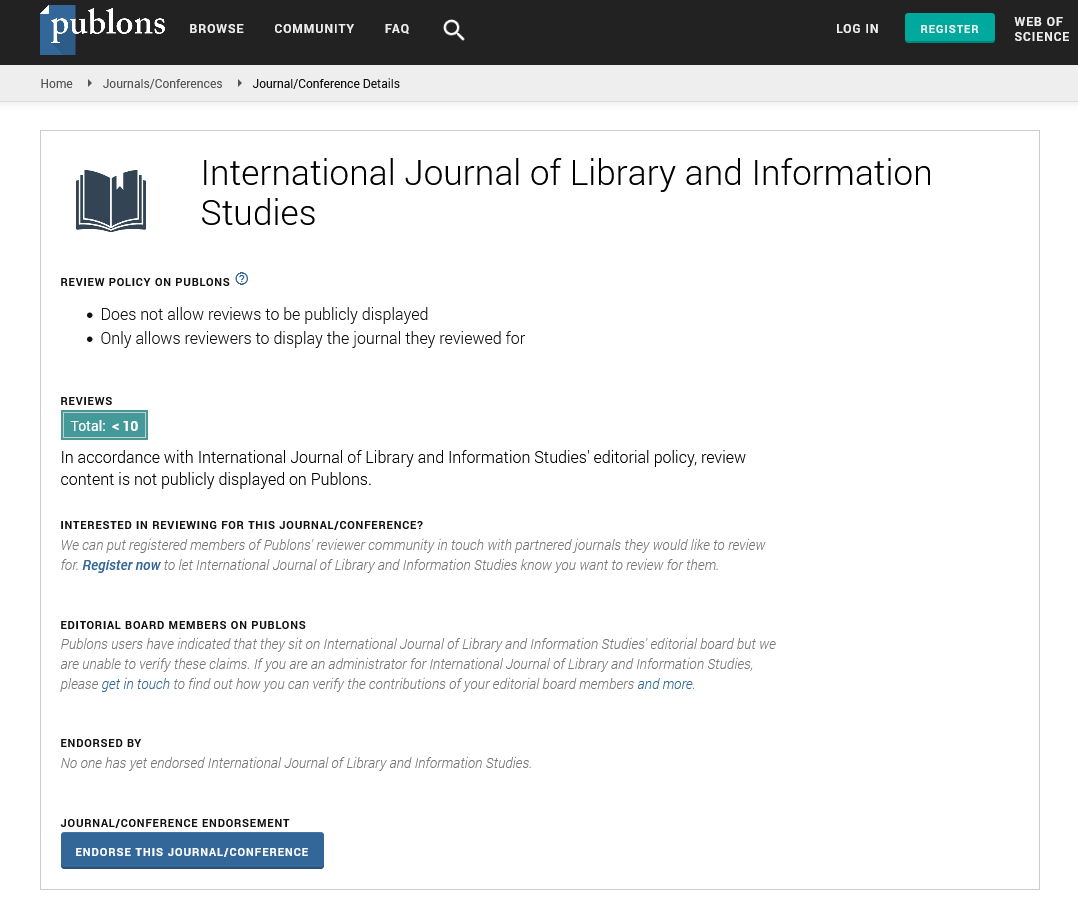
International Journal of Library and Information Studies peer review process verified at publons
Indexed In
Bibliography & Citation Tools