Review Article - (2025) Volume 14, Issue 1
Applications of Bradford's Law of Scattering of Monkeypox Virus Literature on Global Research: A Bibliometric Analysis
Mahendra Kumar Patel* and Maya VermaAbstract
Over the past few years, monkeypox has gained attention and concern. This rare viral disease, similar to smallpox, is caused by the monkeypox virus and primarily affects animals such as rodents, monkeys, and other mammals in Central and West Africa. The aim of the study is to analyze the growth and trend of monkeypox research at global level from 1989 to 2023 and data has been retrieved from Web of Science database. The analysis includes source-wise, country-wise, author-wise distribution, Relative Growth Rate (RGR) and Doubling Time (DT). The study found that 484 articles were scattered in 155 journals. The most productive journal is found to be Journal of Virology with 126 articles followed by Virology with 41 articles. Ruml T was the most productive author during the study period and published 75 articles and received 1208 Global citation score. USA, Czech Republic were the most contributing countries in the world. Bradford’s law of scattering is tested and found the data set is not fitted in this law. The Bradford’s multiplier is 8.81 and found error percentage is high i.e., 10.6.
Keywords
Monkeypox virus, Bibliometric, Relative growth rate, Bradford’s law, Author productivity, Authorship pattern.
Introduction
The monkeypox virus is an orthopoxvirus that causes mpox (monkeypox), a disease with symptoms similar to smallpox, although less severe. While smallpox was eradicated in 1980, mpox continues to occur in countries of central and West Africa. Since May 2022, cases have also been reported from countries without previously documented mpox transmission outside the African region. (Monkeypox) Mpox is a rare disease similar to smallpox caused by the mpox virus. It’s found mostly in areas of Africa, but has been seen in other regions of the world. It causes flu-like symptoms such as fever and chills, and a rash that can take weeks to clear. There’s no proven treatment for Mpox, but it usually goes away on its own. Mpox was discovered in 1958 when two outbreaks of a pox-like disease occurred in groups of monkeys being used for research. It’s spread mainly through human contact with infected rodents, but can sometimes be spread through skin-to-skin contact with a person who is infected. There are two known types (clades) of Mpox virus one that originated in Central Africa and one that originated in West Africa. The current world outbreak (2022) is caused by the less severe West African clade [1].
A rash with sores that can look like pimples or blisters. It could be on the face, inside the mouth, and on other parts of the body, like the hands, feet, chest, genitals, or anus. It goes through different stages, including scabs, before healing. This can take 2-4 weeks. Since Mpox and smallpox are similar, antiviral medicines that protect against smallpox may also help treat Mpox.
Antiviral medicines may be recommended for people who are more likely to get severely ill, such as patients who have weakened immune systems. The U.S. government has two vaccines in the U.S. to protect against Mpox. One was approved for smallpox and Mpox (JYNNEOS), and the other was approved for smallpox (ACAM2000). The continuous emergence of the MPX epidemic has attracted widespread attention around the world and has been suspected to be a potential threat to wider populations [2-4].
Bibliometrics is an emerging thrust area of research from different branches of human knowledge. Bibliometrics has become a standard tool of science policy and research management in the last decades. All significant compilations of science indicators heavily rely on publication and citation statistics and other, more sophisticated bibliometric techniques. Bibliometrics is a quantitative evaluation of publication patterns of all macro and micro communication along with their authorship by mathematical and statistical calculation. Bibliometrics can be applied to any subject area and to most of the problems concerned with written communication. It helps to monitor growth of literature and patterns of research [5]. Bibliometric methodologies are considered useful as supporting tools for decision-making in setting research priorities, tracking the evolution of science and technology, funding allocation, and rewarding scientific excellence, among others.
In the present study, bibliometric analysis is conducted on research on monkeypox virus. In this study, it has been tried to determine the source distribution of monkeypox virus research literature, the types of institutions that participate in it, the language distribution, the year distribution, the relative growth rate and the doubling time, as well as the distribution of publications by country [6].
Literature Review
Yu Weijie, Zhang Xizowen, et al. conducted a bibliometric analysis and key messages of monkeypox research analyzed 1822 articles published in PubMed and Web of Science during the year 2003 to 2022. Bibliometric tools like Vos viewer and CiteSpace used for analyzing and mapping the data. Co-operation pattern used for different authors and countries using Vos viewer software. United States and Centre’s for Disease Control and Prevention-USA (CDC) were the top contributing and country and Institute in producing monkeypox research literature. The study revealed that focus on control method should be suggested than vaccines and future research should be conducted in the field of monkeypox [7].
Rehan Syeda Tayyaba, Hussain Hassan Ul, et al. in their article Global monkeypox virus outbreak 2022: A bibliometric analysis revealed that a gradual increase of publication began in January 2022 and reached a peak in May 2022. Among the European regions, United States has the highest number of research articles of about 41 and 9.87% followed by the United Kingdom 35 and 8.43% of documents. 44 research articles were funded by 82 funding agencies while 371 were not. The result finds the articles should be supported financially and administratively. Research on the monkeypox virus needs to be expanded, as original articles are increasingly in demand [8].
Sofyantoro Fajar, Kusuma Hendrix I, et al. conducted a bibliometric analysis on global research profile on monkeypox related literature. Using the SCOPUS database, the data were retrieved till 19 November 2022 from 1962 to 2022. 422 documents were retrieved and mapped and analyzed through bibliometric indicators. It is noticed that 90.3% of documents were published from 2002 and 2022. USA being the top most country on contributing publications followed by UK and India. Indian journal of surgery, journal of medical virology and travel medicine and infectious disease received more citations. The literature growth rate gradually increased from 2003 and highest published from beginning of 2022.
Lin Jiyong, LI Guiju, et al conducted a bibliometric analysis of human monkeypox research and novel prevention and control strategies. From Web of Science Core Collection, the data were retrieved from 1975-2022. It is noticed that 1008 publications were downloaded on monkeypox research. By using Vos viewer software, bibliometric analysis was performed. The study noticed that American researcher published 663 papers and USA being the top contributing country on monkeypox researches. Journal of Virology ranked first in contributing publications. It was noticed that human monkeypox literature was grown from 2003. Through the bibliometric analysis it is found that in the field of monkeypox research deserves more attention in further research, policy making, treatment and management [9].
Adeiza Shuaibu, Shuaibu Abdul Malik in their research paper titled “Trends in Monkeypox research: A sixty-year bibliometric analysis" describes the research output and trend in monkeypox from 1962-2022. The study analyzed the country wise distribution, year wise distribution, prolific author etc. The study explored different bibliometric tools like Bibliometrix, Biblio, Vos viewer, CiteNetExplorer and Sci2tool for analyzing the documents. Quantitative methods used in bibliometric analysis of articles. The study revealed that US was the top contributing country followed by Germany, UK, Russia and DRC. Among African countries, Nigeria and DRC (Democratic Republic of the Congo) has the most documents on monkeypox virus [10].
Zeeshan Hafiz Muhammad, Rubab Aqsa, et al examined a study on global research trends on Monkeypox virus: A bibliometric and visualized study. The study revealed that the top contributing country in monkeypox virus was US of about 275 documents. 365 publications contributed by the top organization centers for disease control and prevention from United States. Journal of Virology has most citations and h-index of 18. The result revealed that overall worldwide contribution United States had top contributing and seen significant growth in production of Monkeypox research articles [10-12].
Objectives of the study
The primary objective of the study is to know the research output in the monkeypox virus research during the study period of 1989-2023. The objectives of the study are as fallows.
• To find out the source wise distribution in the field of monkeypox virus.
• To find out the year wise distribution of the articles. • To study the relative growth rate and doubling time of articles.
• To study the journal distribution of the articles.
• To find the geographical wise distribution of articles.
• To find the most prolific author.
• To evaluate the Authorship pattern.
• To verify the Bradford law of scattering in monkeypox literature.
Methodology
In this research, we used Web of Science to search for 484 publications related to monkeypox from 1989-2023. The data is collected till 24 May 2023. Search terms used for the collection of data were "Monkey pox" or "Monkey virus". Using Web of Science, the data was retrieved in Text (txt) format. The data was then analyzed using Histcite and Biblioshiny software programs and the results were presented in tables and graphs generated from Microsoft Excel. The aim of this study is to provide an overview of the current state of knowledge on monkeypox through a comprehensive analysis of these publications [13,14].
Results
Data analysis and interpretation
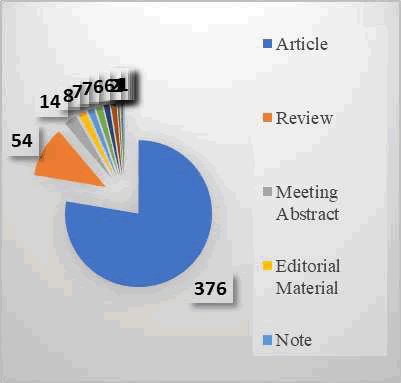
Source wise distribution: Table 1 and Figure 1 depict the publication distributions by source for Monkeypox virus research. The highest publication is the journal article with 376 publications, followed by reviews with 54 publications, meeting abstracts with 14 publications, and early access, book chapters, editorial materials, and book reviews with one publication each.
| S. no | Source | Records |
|---|---|---|
| 1 | Article | 376 |
| 2 | Review | 54 |
| 3 | Meeting abstract | 14 |
| 4 | Editorial material | 8 |
| 5 | Note | 7 |
| 6 | Letter | 7 |
| 7 | Article; proceedings paper | 6 |
| 8 | News item | 6 |
| 9 | Letter; early access | 2 |
| 10 | Article; early access | 1 |
| 11 | Article; book chapter | 1 |
| 12 | Editorial material; early access | 1 |
| 13 | Book review | 1 |
| Total | 484 |
Table 1: Source wise distribution of publication
Figure 1: Graph shows the source wise distribution of publication
Year wise distribution
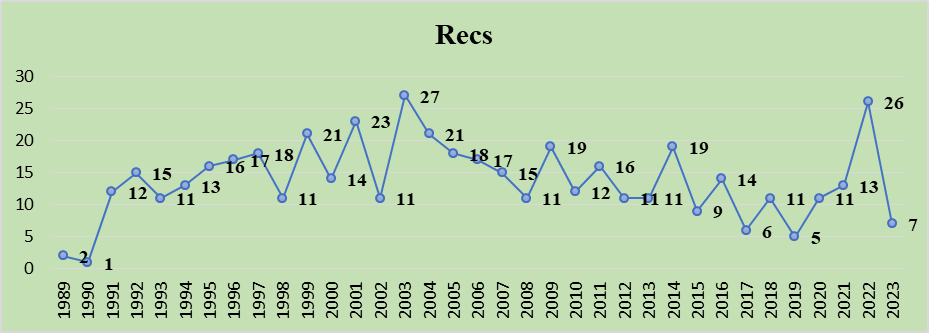
Table 2 shows the year wise publication. The highest publication is in 2003 with 27 publications followed by 26 publications in 2022 and 23 publications in 2001. The least publication is 01 publications in 1990. A graph depicting the growth and decline in publications related to monkeypox research can be seen in the Figure 2.
| S. N | Publication year | Recs | GCS | % | S. N | Publication year | Recs | GCS | % |
|---|---|---|---|---|---|---|---|---|---|
| 1 | 1989 | 2 | 19 | 0.41 | 19 | 2007 | 15 | 609 | 3.10 |
| 2 | 1990 | 1 | 1 | 0.21 | 20 | 2008 | 11 | 738 | 2.27 |
| 3 | 1991 | 12 | 802 | 2.48 | 21 | 2009 | 19 | 350 | 3.93 |
| 4 | 1992 | 15 | 809 | 3.10 | 22 | 2010 | 12 | 236 | 2.48 |
| 5 | 1993 | 11 | 301 | 2.27 | 23 | 2011 | 16 | 821 | 3.31 |
| 6 | 1994 | 13 | 966 | 2.69 | 24 | 2012 | 11 | 331 | 2.27 |
| 7 | 1995 | 16 | 1069 | 3.31 | 25 | 2013 | 11 | 289 | 2.27 |
| 8 | 1996 | 17 | 815 | 3.51 | 26 | 2014 | 19 | 341 | 3.93 |
| 9 | 1997 | 18 | 869 | 3.72 | 27 | 2015 | 9 | 362 | 1.86 |
| 10 | 1998 | 11 | 587 | 2.27 | 28 | 2016 | 14 | 180 | 2.89 |
| 11 | 1999 | 21 | 1325 | 4.34 | 29 | 2017 | 6 | 53 | 1.24 |
| 12 | 2000 | 14 | 520 | 2.89 | 30 | 2018 | 11 | 53 | 2.27 |
| 13 | 2001 | 23 | 1045 | 4.75 | 31 | 2019 | 5 | 37 | 1.03 |
| 14 | 2002 | 11 | 888 | 2.27 | 32 | 2020 | 11 | 71 | 2.27 |
| 15 | 2003 | 27 | 1422 | 5.58 | 33 | 2021 | 13 | 75 | 2.69 |
| 16 | 2004 | 21 | 777 | 4.34 | 34 | 2022 | 26 | 25 | 5.37 |
| 17 | 2005 | 18 | 548 | 3.72 | 35 | 2023 | 7 | 5 | 1.45 |
| 18 | 2006 | 17 | 437 | 3.51 | Total | 484 | 100.00 |
Table 2: Year wise distribution of publication
Figure 2: This graph shows the year wise distribution of publication
Relative growth rate and doubling time
The mathematical representation of the mean relative growth rate of articles over a specific period is derived from the following formula:
RGR = W 2 -W 1/ T 2 -T1
where RGR=Growth Rate over the specific period of the interval
W1=Log (natural log of the initial number of contributions)
W2=Log (natural log of the final number of contributions)
T1=The unit of initial time
T2=The unit of final time(Verma and Shukla)
Doubling time formula: Dt=0.693/R
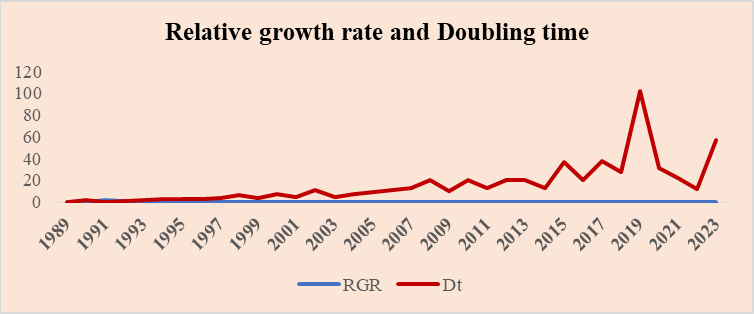
Table 3 indicates the relative growth rate and doubling time of publications on Monkeypox research. RGR means the increase in the number of publications per unit of time. It is also called the exponential growth rate or continuous growth rate concerning scientific literature publication. In 1992, the relative growth rate of publications was 0.69, but by 2023 it drops to 0.01. Over the first five years (1989 to 1993), the mean relative growth rate was 0.60, but over the last five years (2019 to 2023) it was 0.01.
The doubling time is related to RGR. The doubling time of publications was increased from 1.70 in 1990 to 102.15 in 2019. The table shows a decrease in relative growth rate and an increase in doubling time (Figure 3).
| Relative growth rate | |||||||
|---|---|---|---|---|---|---|---|
| Publication year | Recs | Cumulative | W1 | W2 | RGR | Mean | Dt |
| 1989 | 2 | 2 | 0 | 0.69 | 0 | 0.60 | 0 |
| 1990 | 1 | 3 | 0.69 | 1.10 | 0.41 | 1.70 | |
| 1991 | 12 | 15 | 1.10 | 2.71 | 1.61 | 0.43 | |
| 1992 | 15 | 30 | 2.71 | 3.40 | 0.69 | 1.00 | |
| 1993 | 11 | 41 | 3.40 | 3.71 | 0.31 | 2.21 | |
| 1994 | 13 | 54 | 3.71 | 3.99 | 0.28 | 0.21 | 2.48 |
| 1995 | 16 | 70 | 3.99 | 4.25 | 0.26 | 2.68 | |
| 1996 | 17 | 87 | 4.25 | 4.47 | 0.22 | 3.21 | |
| 1997 | 18 | 105 | 4.47 | 4.65 | 0.18 | 3.77 | |
| 1998 | 11 | 116 | 4.65 | 4.75 | 0.10 | 6.69 | |
| 1999 | 21 | 137 | 4.75 | 4.92 | 0.17 | 0.12 | 4.08 |
| 2000 | 14 | 151 | 4.92 | 5.02 | 0.10 | 7.12 | |
| 2001 | 23 | 174 | 5.02 | 5.16 | 0.14 | 4.98 | |
| 2002 | 11 | 185 | 5.16 | 5.22 | 0.06 | 11.48 | |
| 2003 | 27 | 212 | 5.22 | 5.36 | 0.14 | 5.07 | |
| 2004 | 21 | 233 | 5.36 | 5.45 | 0.09 | 0.06 | 7.61 |
| 2005 | 18 | 251 | 5.45 | 5.53 | 0.08 | 9.18 | |
| 2006 | 17 | 268 | 5.53 | 5.59 | 0.06 | 11.36 | |
| 2007 | 15 | 283 | 5.59 | 5.65 | 0.06 | 12.50 | |
| 2008 | 11 | 294 | 5.65 | 5.68 | 0.03 | 20.64 | |
| 2009 | 19 | 313 | 5.68 | 5.75 | 0.07 | 0.04 | 10.47 |
| 2010 | 12 | 325 | 5.75 | 5.78 | 0.03 | 20.49 | |
| 2011 | 16 | 341 | 5.78 | 5.83 | 0.05 | 13.36 | |
| 2012 | 11 | 352 | 5.83 | 5.86 | 0.03 | 20.61 | |
| 2013 | 11 | 363 | 5.86 | 5.89 | 0.03 | 20.14 | |
| 2014 | 19 | 382 | 5.89 | 5.95 | 0.06 | 0.03 | 12.50 |
| 2015 | 9 | 391 | 5.95 | 5.97 | 0.02 | 37.04 | |
| 2016 | 14 | 405 | 5.97 | 6.00 | 0.03 | 20.45 | |
| 2017 | 6 | 411 | 6.00 | 6.02 | 0.02 | 37.27 | |
| 2018 | 11 | 422 | 6.02 | 6.05 | 0.03 | 27.71 | |
| 2019 | 5 | 427 | 6.05 | 6.06 | 0.01 | 0.03 | 102.15 |
| 2020 | 11 | 438 | 6.06 | 6.08 | 0.02 | 31.19 | |
| 2021 | 13 | 451 | 6.08 | 6.11 | 0.03 | 22.02 | |
| 2022 | 26 | 477 | 6.11 | 6.17 | 0.06 | 12.05 | |
| 2023 | 7 | 484 | 6.17 | 6.18 | 0.01 | 57.34 | |
Table 4: Top 15 Journal wise distribution of publication
Table 3: Relative growth rate and doubling time of publication
Figure 3: Graph shows the relative growth rate and doubling time of publication
Most productive journal
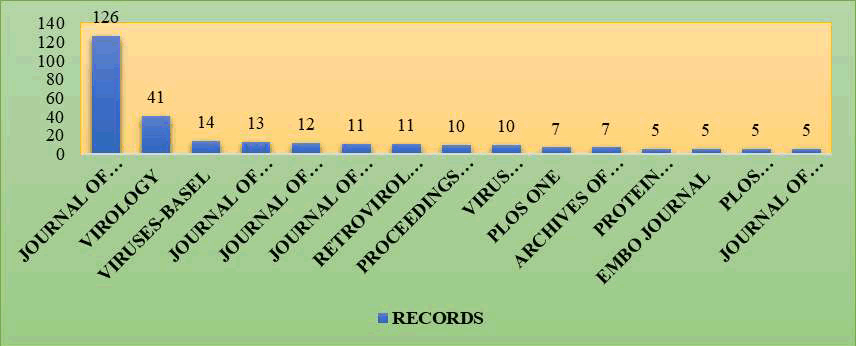
Table 4 revealed the top 15 journal wise distribution of publication. Out of 484 articles, 126 articles have been published in journal of virology, 41 articles in virology, 14 in virus Basel and lowest articles with 5 in journal of virological methods (Figure 4).
| S. no | Journal | Records |
|---|---|---|
| 1 | Journal of Virology | 126 |
| 2 | Virology | 41 |
| 3 | Viruses-Basel | 14 |
| 4 | Journal of Molecular 0Biology | 13 |
| 5 | Journal of Biological Chemistry | 12 |
| 6 | Journal of General Virology | 11 |
| 7 | Retrovirology | 11 |
| 8 | Proceedings of the National Academy of Sciences of the United States of America | 10 |
| 9 | Virus Research | 10 |
| 10 | Plos One | 7 |
| 11 | Archives of Virology | 7 |
| 12 | Protein Expression and Purification | 5 |
| 13 | Embo Journal | 5 |
| 14 | Plos Pathogens | 5 |
| 15 | Journal of Virological Methods | 5 |
Figure 4: Graph shows the top 15 journal wise distribution of publication
Country wise distribution
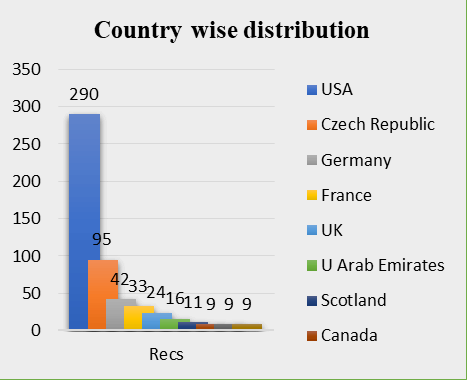
Table 5 shows the highly contributing countries in Monkeypox research. Out of 10 contributing countries USA is the top most contributing country with 290 articles followed by Czech Republic with 95 articles ranked second, 42 from Germany, France contributed 33 publications and India contributes 09 articles and is ranked 10th (Figure 5)
| S. no | Country | Recs | GCS |
|---|---|---|---|
| 1 | USA | 290 | 13403 |
| 2 | Czech Republic | 95 | 1484 |
| 3 | Germany | 42 | 1561 |
| 4 | France | 33 | 1092 |
| 5 | UK | 24 | 973 |
| 6 | U Arab Emirates | 16 | 166 |
| 7 | Scotland | 11 | 215 |
| 8 | Canada | 9 | 322 |
| 9 | Hungary | 9 | 112 |
| 10 | India | 9 | 77 |
Table 5: Top 10 country wise distribution of publication
Figure 5: This graph shows the top 10 country wise distribution of publication.
Prolific author wise distribution
The Table 6 shows the Ruml T was the most productive author during the study period. He published 75 articles and received 1208 Global citation score. Hunter E is the second top contributing author with 62 articles and received 2646 Global citation score. Rumlova M had published 45 articles and received 748 Gcs. The least number of articles was contributed by Briggs JAG with 08 publications and ranked 20. According to the above discussion, Ruml T and Hunter E are emerging as the most prolific authors working in monkeypox research.
| S. no | Author | Recs | GCS |
|---|---|---|---|
| 1 | Ruml T | 71 | 1208 |
| 2 | Hunter E | 62 | 2646 |
| 3 | Rumlova M | 45 | 748 |
| 4 | Pichova I | 36 | 474 |
| 5 | Hrabal R | 20 | 158 |
| 6 | Rizvi TA | 20 | 319 |
| 7 | Hadravova R | 19 | 175 |
| 8 | Krizova I | 18 | 136 |
| 9 | Ulbrich P | 17 | 310 |
| 10 | Hammarskjold ML | 13 | 1273 |
| 11 | Mustafa F | 13 | 118 |
| 12 | Prchal J | 12 | 77 |
| 13 | Rekosh D | 12 | 1231 |
| 14 | Sakalian M | 12 | 245 |
| 15 | Dolezal M | 11 | 72 |
| 16 | Krausslich HG | 11 | 797 |
| 17 | Dostalkova A | 10 | 30 |
| 18 | Goff SP | 9 | 662 |
| 19 | Zabransky A | 9 | 89 |
| 20 | Briggs JAG | 8 | 602 |
Table 6: Top 20 Author wise distribution of publication
Authorship pattern of publication
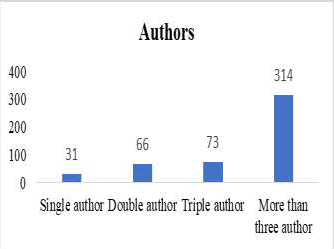
Table 7 shows the authorship pattern of articles. Out of 484 articles, 31 (6.40%) articles are written by single authors, 66 (13.64%) articles are written by double authors, 73 (15.08%) articles are written by triple author and 314 (64.88%) articles are written by more than three authors. It is evident that multiple authors predominate over single, double, and triple authors. Authorship patterns reveal a significant difference between single and multiple authors (Figure 6).
| S. no | No of authors | Records | Percentage |
|---|---|---|---|
| 1 | Single | 31 | 6.4 |
| 2 | Double | 66 | 13.64 |
| 3 | Triple | 73 | 15.08 |
| 4 | More than three author | 314 | 64.88 |
| Total | 484 | 100 |
Figure 6: Graph shows the authorship pattern of publication.
Ranking of journals
Table 8 shows the ranked list of journals. In the study period from 1989 to 2023, the author preferred journals. A total of 484 articles were published in 155 journals. Almost one third of all articles are published in the top 3 journals. The most preferred journal is Journal of Virology with 126 articles followed by Virology with 41 articles and Viruses-Basel with 14 articles.
| S. No | Source | Rank | Freq | CumFreq |
|---|---|---|---|---|
| 1 | Journal of Virology | 1 | 126 | 126 |
| 2 | Virology | 2 | 41 | 167 |
| 3 | Viruses-Basel | 3 | 14 | 181 |
| 4 | Journal of Molecular Biology | 4 | 13 | 194 |
| 5 | Journal of Biological Chemistry | 5 | 12 | 206 |
| 6 | Journal of General Virology | 6 | 11 | 217 |
| 7 | Retrovirology | 7 | 11 | 228 |
| 8 | Proceedings of the National Academy of Sciences of the United States of America | 8 | 10 | 238 |
| 9 | Virus research | 9 | 10 | 248 |
| 10 | Archives of Virology | 10 | 7 | 255 |
| 11 | Plos One | 11 | 7 | 262 |
| 12 | Embo Journal | 12 | 5 | 267 |
| 13 | European Review for Medical and Pharmacological Sciences | 13 | 5 | 272 |
| 14 | Journal of Virological Methods | 14 | 5 | 277 |
| 15 | Plos Pathogens | 15 | 5 | 282 |
| 16 | Protein Expression and Purification | 16 | 5 | 287 |
| 17 | Febs Journal | 17 | 4 | 291 |
| 18 | Febs Open Bio | 18 | 4 | 295 |
| 19 | Journal of Medical Primatology | 19 | 4 | 299 |
| 20 | Nature | 20 | 4 | 303 |
| 21 | RNA | 21 | 4 | 307 |
| 22 | Aids | 22 | 3 | 310 |
| 23 | Aids research and Human Retroviruses | 23 | 3 | 313 |
| 24 | Biomolecular Nmr Assignments | 24 | 3 | 316 |
| 25 | Chemicke Listy | 25 | 3 | 319 |
| 26 | Frontiers in microbiology | 26 | 3 | 322 |
| 27 | Journal of cellular biochemistry | 27 | 3 | 325 |
| 28 | Journal of neurovirology | 28 | 3 | 328 |
| 29 | Protein science | 29 | 3 | 331 |
| 30 | Traffic | 30 | 3 | 334 |
| 31 | Acta crystallographica section d-structural biology | 31 | 2 | 336 |
| 32 | Acta virologica | 32 | 2 | 338 |
| 33 | Antiviral research | 33 | 2 | 340 |
| 34 | Archives of biochemistry and biophysics | 34 | 2 | 342 |
| 35 | Febs letters | 35 | 2 | 344 |
| 36 | Gene therapy | 36 | 2 | 346 |
| 37 | Human gene therapy | 37 | 2 | 348 |
| 38 | Immunology letters | 38 | 2 | 350 |
| 39 | International journal of cancer | 39 | 2 | 352 |
| 40 | International journal of molecular sciences | 40 | 2 | 354 |
| 41 | Jnci-journal of the national cancer institute | 41 | 2 | 356 |
| 42 | Journal of biomolecular nmr | 42 | 2 | 358 |
| 43 | Journal of cell biology | 43 | 2 | 360 |
| 44 | Laboratory animal science | 44 | 2 | 362 |
| 45 | Medical hypotheses | 45 | 2 | 364 |
| 46 | Molecular and cellular biology | 46 | 2 | 366 |
| 47 | Molecular biology | 47 | 2 | 368 |
| 48 | Molecular biology of the cell | 48 | 2 | 370 |
| 49 | Molecules | 49 | 2 | 372 |
| 50 | New scientist | 50 | 2 | 374 |
| 51 | Nucleic acids research | 51 | 2 | 376 |
| 52 | Science | 52 | 2 | 378 |
| 53 | Scientific reports | 53 | 2 | 380 |
| 54 | Seminars in cell & developmental biology | 54 | 2 | 382 |
| 55 | Tijdschrift voor diergeneeskunde | 55 | 2 | 384 |
| 56 | Acta neurologica scandinavica | 56 | 1 | 385 |
| 57 | Acta psychiatrica scandinavica | 57 | 1 | 386 |
| 58 | Acta veterinaria hungarica | 58 | 1 | 387 |
| 59 | American journal of hematology | 59 | 1 | 388 |
| 60 | American journal of obstetrics & gynecology mfm | 60 | 1 | 389 |
| 61 | Analytical biochemistry | 61 | 1 | 390 |
| 62 | Analytical chemistry | 62 | 1 | 391 |
| 63 | Animation-an interdisciplinary journal | 63 | 1 | 392 |
| 64 | Annual review of virology, vol 1 | 64 | 1 | 393 |
| 65 | Antioxidants | 65 | 1 | 394 |
| 66 | Applied sciences-basel | 66 | 1 | 395 |
| 67 | Aspartic proteinases: retroviral and cellular enzymes | 67 | 1 | 396 |
| 68 | Australasian journal of dermatology | 68 | 1 | 397 |
| 69 | Biochemical society transactions | 69 | 1 | 398 |
| 70 | Biochemistry | 70 | 1 | 399 |
| 71 | Biologicals | 71 | 1 | 400 |
| 72 | Biomed research international | 72 | 1 | 401 |
| 73 | Biomedicines | 73 | 1 | 402 |
| 74 | Bioorganic & medicinal chemistry | 74 | 1 | 403 |
| 75 | Biotechnology advances | 75 | 1 | 404 |
| 76 | British journal of cancer | 76 | 1 | 405 |
| 77 | Bulletin of experimental biology and medicine | 77 | 1 | 406 |
| 78 | Bundesgesundheitsblatt-gesundheitsforschung-gesundheitsschutz | 78 | 1 | 407 |
| 79 | Cell host & microbe | 79 | 1 | 408 |
| 80 | Cellular microbiology | 80 | 1 | 409 |
| 81 | Cerebral cortex | 81 | 1 | 410 |
| 82 | Clinical chemistry | 82 | 1 | 411 |
| 83 | Clinical gastroenterology and hepatology | 83 | 1 | 412 |
| 84 | Clinics in laboratory medicine | 84 | 1 | 413 |
| 85 | Comparative immunology microbiology and infectious diseases | 85 | 1 | 414 |
| 86 | Computational Biology and Chemistry | 86 | 1 | 415 |
| 87 | Current opinion in Structural Biology | 87 | 1 | 416 |
| 88 | Embo Reports | 88 | 1 | 417 |
| 89 | Emerging Infectious diseases | 89 | 1 | 418 |
| 90 | European Journal of Biochemistry | 90 | 1 | 419 |
| 91 | Fractals-Complex Geometry Patterns and Scaling in Nature and Society | 91 | 1 | 420 |
| 92 | Frontiers in Immunology | 92 | 1 | 421 |
| 93 | Frontiers in Public Health | 93 | 1 | 422 |
| 94 | Future Medicinal Chemistry | 94 | 1 | 423 |
| 95 | Genetic Analysis-Biomolecular Engineering | 95 | 1 | 424 |
| 96 | Indian Journal of Dermatology | 96 | 1 | 425 |
| 97 | Indian Journal of Medical Microbiology | 97 | 1 | 426 |
| 98 | International Journal of Infectious diseases | 98 | 1 | 427 |
| 99 | International Journal of Surgery | 99 | 1 | 428 |
| 100 | Intervirology | 100 | 1 | 429 |
| 101 | 55 journals with 1 article | 55 | 55 | 55 |
| 155 Journals | 484 | 484 |
Table 8: Ranked list of journals
Discussion
Application of Bradford law of scattering
Samuel Clement Bradford, observed the scattering of articles on specific subjects in various journals. He pointed out that if scientific journals are arranged in order of decreasing productivity of articles on a given subject, they may be divided into a nucleus of periodicals more particularly devoted to the subject and several groups and zones containing the same number of articles as the nucleus when the number of periodicals in the nucleus and succeeding zones will be 1: n: n2. Bradford’s Law states that journals in a single field can be divided into three parts, each containing the same number of articles
• A core of journals on the subject, relatively few in number, that producesapproximately one-third of all the articles;
• A second zone, containing the same number of articles as the first, but a greater number of journals, and
• A third zone, containing the same number of articles as the second, but a still greater number of journals.
The mathematical relationship of the number of journals core to the first zone is a constant n and to the second zone, the relationship is n². Bradford expressed this relationship as 1:n:n² (Table 9).
| Zone | Number of journals | Number of articles | Percentage | Bradford multiplier |
|---|---|---|---|---|
| 1 | 02 | 167 | 34.50 | - |
| 2 | 25 | 158 | 32.64 | 12.5 |
| 3 | 128 | 159 | 32.85 | 5.12 |
| Total | 155 | 484 | 99.99 | Mean 8.81 |
Table 9: Bradford’s law of scattering in Monkeypox literature
The Bradford’s mathematical interpretation of the law is 1:n: n2. The total numbers of journal articles were grouped into 3 equal zones producing similar number of articles. It is observed that 155 journals contain 484 articles and these 155 journals divided into three zones, i.e., 1st zone contain 02 journals that covered 167 articles, 2nd zone contain 25 journals covered 158 articles and 3rd zone contain 128 journals covered 159 articles. 1/3 of articles covered by three zones. The connection of each zone in this study is 02:25:128. Here 02 is the number of journals in the nucles zone and mean Bradford’s multiplier ‘n’ is 8.81.
Here, 2: 2 × 8.81: 2 × (8.81)2
2: 17.62: 155.2322>174.8522
Percentage error = (174.85-155)/155 × 100 = 19.85/155× 100 = 10.56
Based on the data, it is clear that the Error Percentage is very high. The distribution of monkeypox literature does not fit Bradford's Law of Scattering.
Findings
The major findings of the monkeypox research are as follows:
• The finding shows the highest publication is the journal article with 376 publications followed by 54 publications Reviews and 14 publications meeting abstracts and least with early access, book chapter and editorial material.
• The highest number of articles was published in the year 2003 is 27 (5.58%), where least number of articles was published in the year 1990 i.e., 1 (0.21%).
• The finding reveals the relative growth rate is decreasing i.e., in 1992 was 0.69 but by 2023 it drops to 0.01, and doubling time of publication is increasing i.e., 1.70 in 1990 to 102.15 in 2019.
• Journal of virology contributed highest number of articles i.e., 126 out of 484 articles. USA, Czech Republic and Germany were the leading countries of maximum contribution and contributed 290, 95 and 42articles.
• Ruml T, Hunter E, Rumlova M and Pichova were the most productive author of monkeypox virus research.
According to Bradford’s law the relationship of is zone is 1:n:n2 and the findings shows the error percentage is high so the Bradford’s law of scattering is not fitted in monkeypox research.
Conclusion
In conclusion, the research on monkeypox has revealed several important findings. The analysis of monkeypox research based on source-wise, year-wise, author-wise, country-wise and ranking of journals perspectives has provided valuable insights. It has helped identify prolific authors and countries that have made significant contributions to this field. It is found that Bradford Law does not fit well when analyzing the distribution of research articles on monkeypox. Further research should focus on exploring new treatment options, improving diagnostic methods, and developing effective prevention strategies. In conclusion, while there is still much to learn about monkeypox, it is important for future research to be based on current research. Based on these findings and research gaps, we can make progress towards better control and management of this infectious disease.
References
- Adeiza, S., and Abdulmalik, S. “Trends in Monkeypox Research: A Sixty Year Bibliometric Analysis.” Microbes Infect Dis. 3. 3 (2022): 500-13.
- Gong, Q., et al. “Monkeypox Virus: A Re-Emergent Threat to Humans.” Virol Sin. 37. 4 (2022): 477-82.
[Crossref] [Google Scholar] [PubMed]
- Khandare, S., and B, Sonwane, S., S. ‘’Citation analysis of economics Ph. D. theses of Dr. Babasaheb Ambedkar Marathwada university Aurangabad: A scientometric study.’’ J Ind Lib Assoc. 57.2 (2022): 50-59.
- Laws of Bibliometrics. ‘’Application of Bibliometrics Laws.’’ Limbd Org. (2023).
- Lin J., et al. “Bibliometric Analysis of Human Monkeypox Research from 1975 to 2022 and Novel Prevention and Control Strategies.” Front Public Health. 10 (2022).
[Crossref] [Google Scholar] [PubMed]
- Mardiana S., et al. ‘’Measuring Digital Literacy for Students With Visual Impairments.’’ Library Philosophy and Practice Digital Commons at University of Nebraska - Lincoln. 43.12 (2019): 2–14.
- Mejia, C., et al. “Exploring Topics in Bibliometric Research Through Citation Networks and Semantic Analysis.” Front Res Metr Anal. 6 (2021):1–16.
[Crossref] [Google Scholar] [PubMed]
- WHO. Monkeypox. Republic of South Africa. 2023.
- Rehan, S. T., et al. ‘’Global Monkeypox Virus Outbreak 2022 ⁚ A Bibliometric Analysis.’’ Cureus. 15.4 (2023).
[Crossref] [Google Scholar] [PubMed]
- S, Shilpa B, and S. Padmamma. “Growth of Literature on Oncology: A Scientometric Analysis.” Int J Lib Infor Stud. 10. 4 (2020): 2231-4911.
- Sofyantoro, F, et al. “Global Research Profile on Monkeypox-Related Literature (1962–2022): A Bibliometric Analysis.” Narra J. 2.3 (2022): 96.
- Verma, M. K.; & Ravi, S. “Mapping the Research Trends on Information Literacy of Selected Countries during 2008-2017: A Scientometric Analysis.” DESIDOC J Lib Infor Tech. 39. 3 (2019):125–30.
- Yu, W, et al. “Bibliometric Analysis and Key Messages of Monkeypox Research (2003–2022).” Sustainability. 15.2 (2023):1005.
- Zeeshan, H. M., et al. “Global Research Trends on Monkeypox Virus: A Bibliometric and Visualized Study.” Trop Med Infect Dis. 7. 12 (2022).
[Crossref] [Google Scholar] [PubMed]
Author Info
Mahendra Kumar Patel* and Maya VermaReceived: 04-Aug-2023, Manuscript No. IJLIS-23-109280; Editor assigned: 08-Aug-2023, Pre QC No. IJLIS-23-109280 (PQ); Reviewed: 22-Aug-2023, QC No. IJLIS-23-109280; Revised: 14-Jul-2025, Manuscript No. IJLIS-23-109280 (R); Published: 16-Aug-2025, DOI: 10.35248/2231-4911.25.15.857
Copyright: This is an open access article distributed under the terms of the Creative Commons Attribution License, which permits unrestricted use, distribution, and reproduction in any medium, provided the original work is properly cited.
Call for Papers
Authors can contribute papers on
What is Your ORCID
Register for the persistent digital identifier that distinguishes you from every other researcher.
Social Bookmarking
Know Your Citation Style
American Psychological Association (APA)
Modern Language Association (MLA)
American Anthropological Association (AAA)
Society for American Archaeology
American Antiquity Citation Style
American Medical Association (AMA)
American Political Science Association(APSA)


